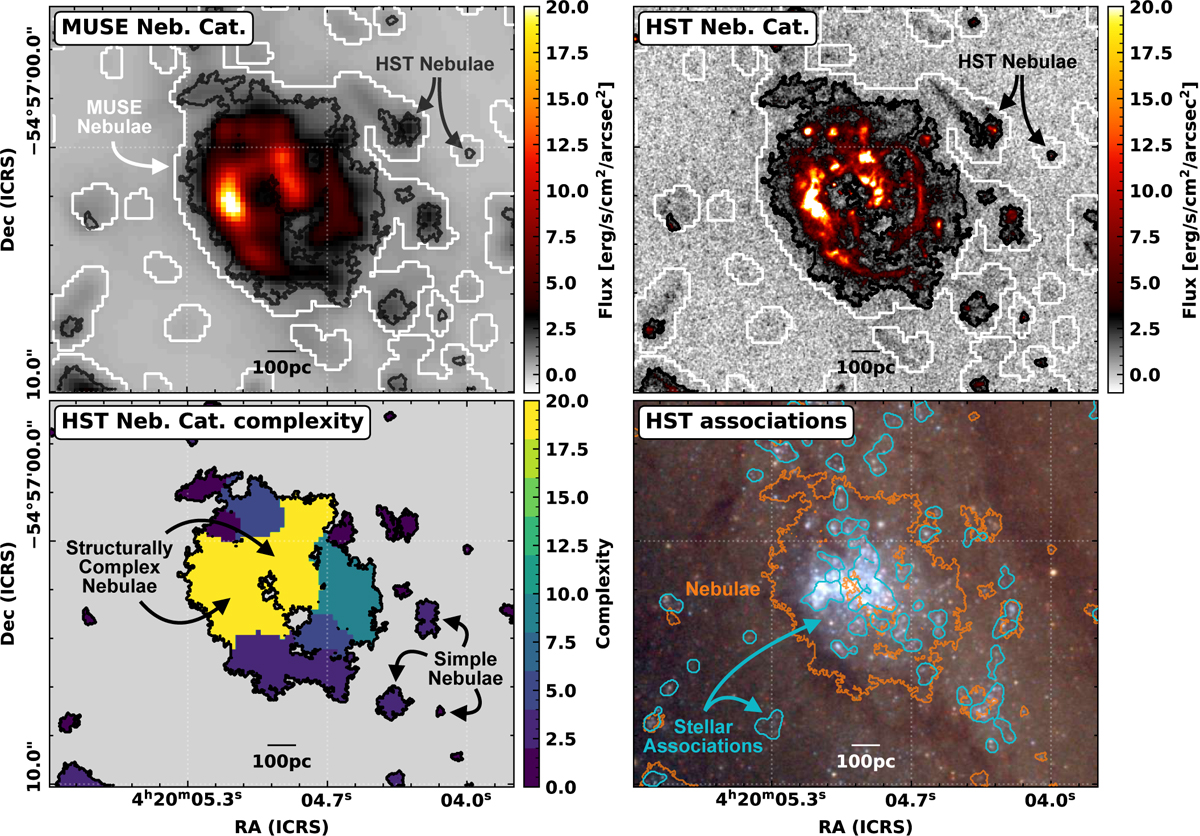
Fig. 2
Download original image
Example of a H II complex region in NGC 1566 (see Sect. 3.4). (Upper left panel) MUSE observations and (upper right) HST Hα observations that are smoothed to a physical scale of 10 pc and with a fixed noise level (see Sect. 3.1). Each of these are overlaid with contours showing the boundary of the sources identified in the MUSE (white) and HST (black) observations. (Lower left panel) A map of the complexity score for the region (see Sect. 4.1). (Lower right panel) We show the nebula (orange contours) and 32 pc NUV-identified association (Larson et al. 2023; cyan contour) overlaid on a HST filter red (F814W) green (F555W) blue (F438W+F336W) image (see Lee et al. 2022). See Fig. C.1 for additional examples of simple, intermediate and complex nebulae within NGC 1566.
Current usage metrics show cumulative count of Article Views (full-text article views including HTML views, PDF and ePub downloads, according to the available data) and Abstracts Views on Vision4Press platform.
Data correspond to usage on the plateform after 2015. The current usage metrics is available 48-96 hours after online publication and is updated daily on week days.
Initial download of the metrics may take a while.