Fig. I.1
Download original image
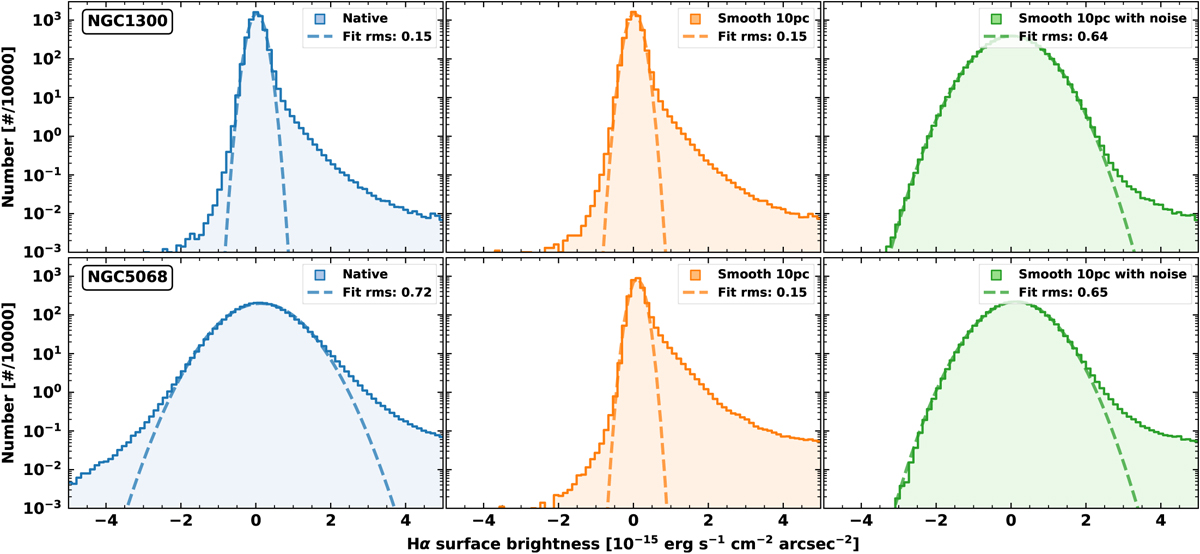
Pixel-value distributions of Hα surface brightness for two representative galaxies. Shown are histograms of the HST Hα images for NGC 1300 (upper panels) and NGC 5068 (lower panels), comparing the native data (left), the data convolved to a fixed physical resolution of 10 pc (middle), and the convolved data with additional noise added (right). Histograms are plotted as step lines with shaded areas, and Gaussian fits to the pixel distributions are overlaid as dashed curves. The fit standard deviation – approximately equivalent to the rms noise level of the image – is given in the legend of each panel in units of 10−15 erg s−1 cm−2 arcsec−2.
Current usage metrics show cumulative count of Article Views (full-text article views including HTML views, PDF and ePub downloads, according to the available data) and Abstracts Views on Vision4Press platform.
Data correspond to usage on the plateform after 2015. The current usage metrics is available 48-96 hours after online publication and is updated daily on week days.
Initial download of the metrics may take a while.