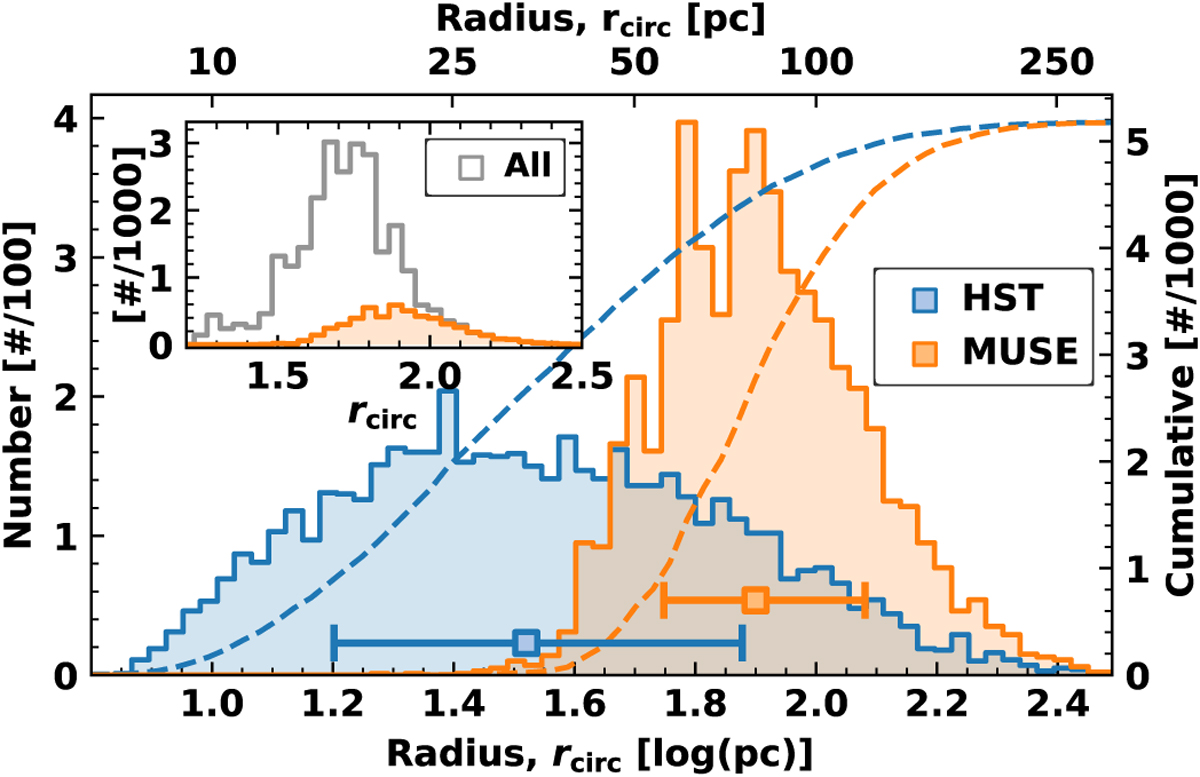
Fig. 4
Download original image
Distribution of source sizes for all galaxies in the PHANGS-MUSE and PHANGS-MUSE/HST-Hα Nebula Catalogue. The histogram distributions of source radii for galaxies identified in both the HST and MUSE observations are shown in blue and orange, respectively. The points with error bars denote the median and standard deviation of the distributions. It is important to note that only sources detected by both HST and MUSE are displayed in the main panel, excluding the full MUSE sample identified by Groves et al. (2023). The distributions extend down to radii of approximately 5 pc, corresponding to the half-width at half-maximum (HWHM) of the assumed Gaussian point spread function (PSF) used to homogenise the observations (see Sect. 3.1). The inset panel presents the distribution of source radii for the full MUSE catalogue (restricted to the HST field of view), alongside those detected in the HST catalogue.
Current usage metrics show cumulative count of Article Views (full-text article views including HTML views, PDF and ePub downloads, according to the available data) and Abstracts Views on Vision4Press platform.
Data correspond to usage on the plateform after 2015. The current usage metrics is available 48-96 hours after online publication and is updated daily on week days.
Initial download of the metrics may take a while.