Fig. 5
Download original image
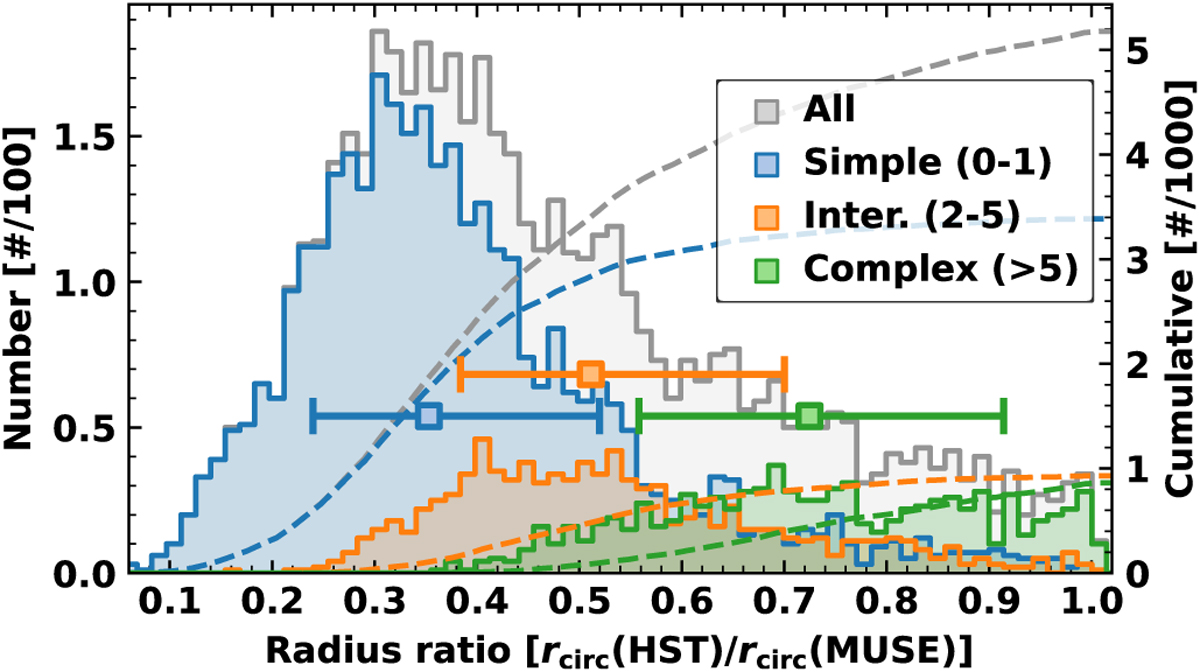
Distribution of source sizes ratios for all galaxies in the Nebula Catalogues relative to MUSE. The ratio of the size of each region identified in both the HST or MUSE observations for all nebulae in the sample is shown in grey. The ratio of the sizes split between complexity scores of 0–1, 2–5, and >5, denoting simple and intermediate and complex regions, respectively are shown as coloured histograms (see Sect. 4.1).
Current usage metrics show cumulative count of Article Views (full-text article views including HTML views, PDF and ePub downloads, according to the available data) and Abstracts Views on Vision4Press platform.
Data correspond to usage on the plateform after 2015. The current usage metrics is available 48-96 hours after online publication and is updated daily on week days.
Initial download of the metrics may take a while.