Fig. 6
Download original image
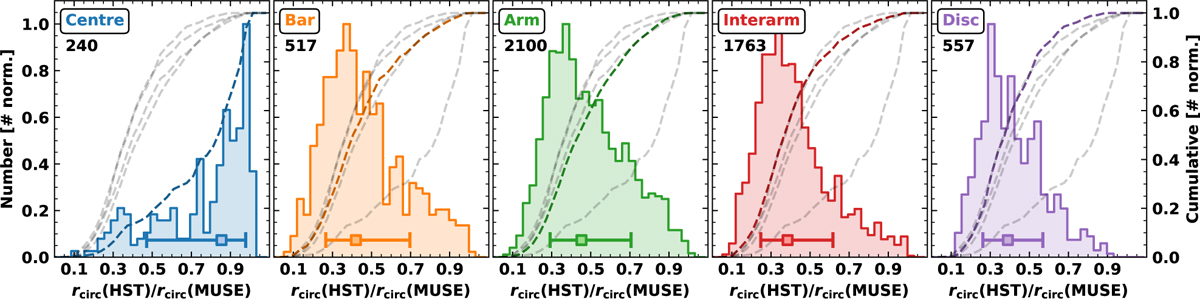
Distribution of source size ratios (HST/MUSE) in the nebula catalogue within each environment (Querejeta et al. 2021). Shown is the ratio of the size of each region identified in both the HST or MUSE observations (see Fig. 4 for full distribution, and see Fig. F.1 for distribution of rcirc for each environment). We show the histogram and cumulative distributions as solid filled and dashed lines, respectively (see upper left number of regions in each histogram). For comparison, all distributions are normalised to unity and overlaid on each panel as light dashed grey lines are the cumulative distributions from the other panels.
Current usage metrics show cumulative count of Article Views (full-text article views including HTML views, PDF and ePub downloads, according to the available data) and Abstracts Views on Vision4Press platform.
Data correspond to usage on the plateform after 2015. The current usage metrics is available 48-96 hours after online publication and is updated daily on week days.
Initial download of the metrics may take a while.