Fig. 7
Download original image
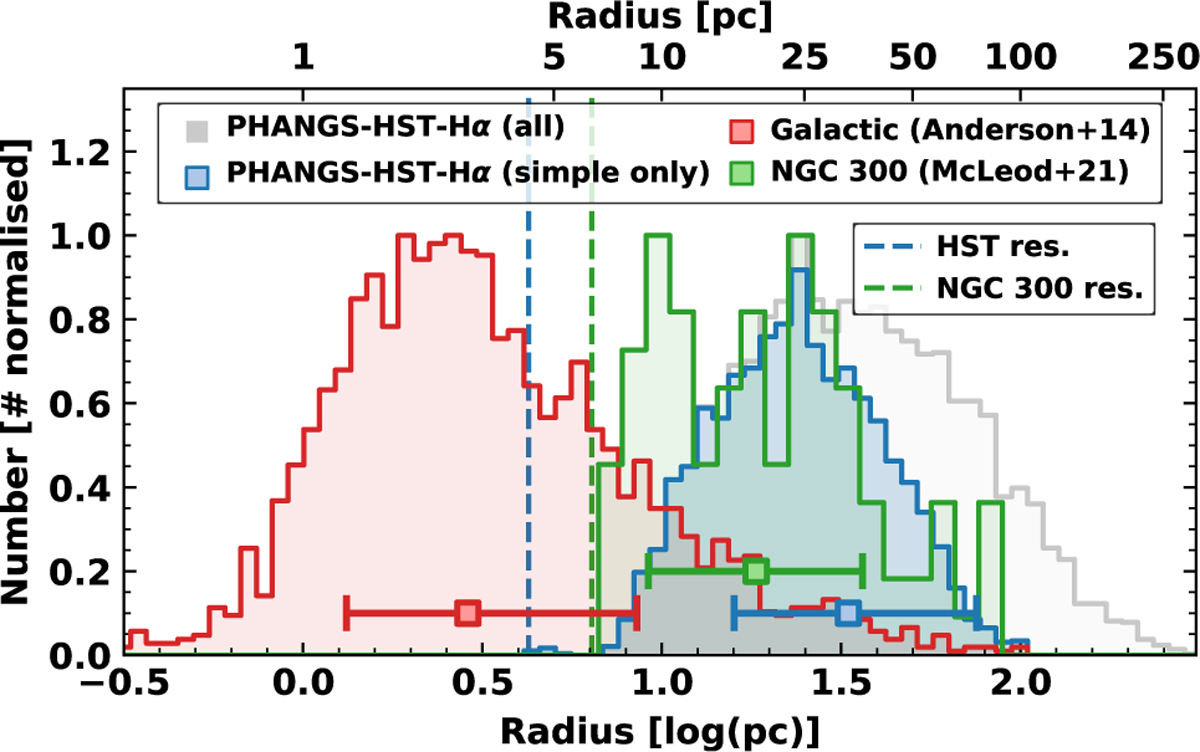
Comparison of radius distributions across samples. Normalised histogram of nebular (rcirc) radii (log scale) for the PHANGS-HST-Hα catalogue (𝒞simp regions only are shown in filled blue, whilst the histogram for all regions is shown in grey), compared with Galactic H II region data from Anderson et al. (2014) and observations of NGC 300 from McLeod et al. (2021). Vertical dashed lines indicate the approximate resolution limits of the HST (blue) and NGC 300 (green) datasets.
Current usage metrics show cumulative count of Article Views (full-text article views including HTML views, PDF and ePub downloads, according to the available data) and Abstracts Views on Vision4Press platform.
Data correspond to usage on the plateform after 2015. The current usage metrics is available 48-96 hours after online publication and is updated daily on week days.
Initial download of the metrics may take a while.