Open Access
Fig. 8
Download original image
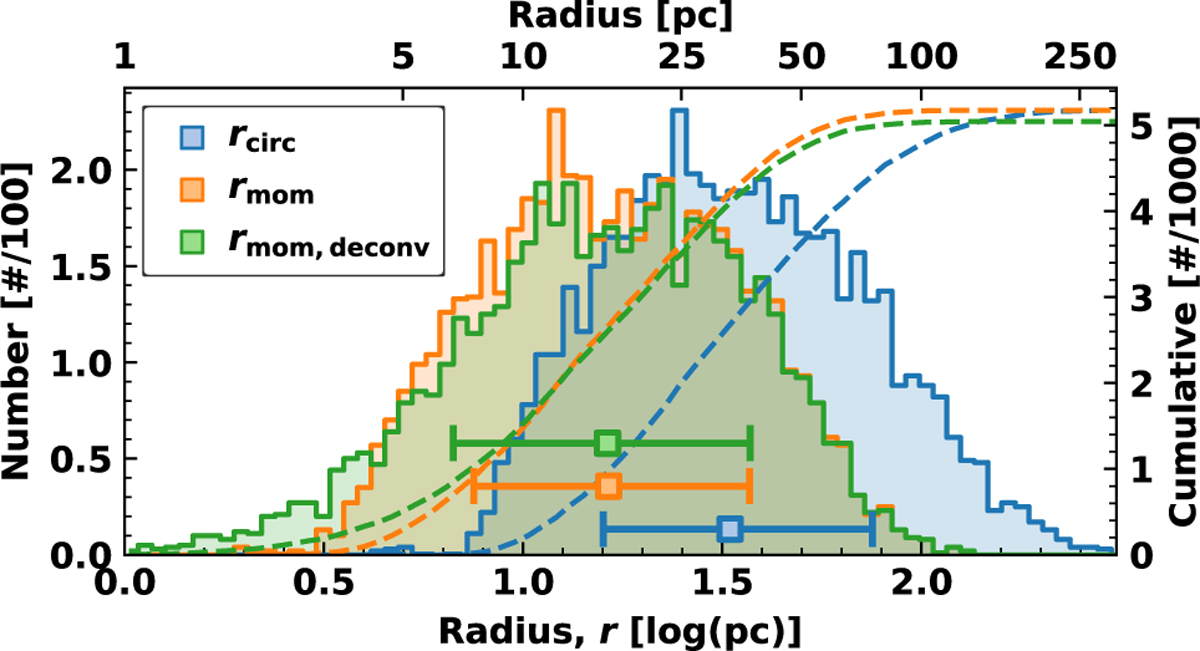
Comparison of the sizes obtained by the circular and the moment methods (see Sect. 4.2). We show the histogram and the cumulative distribution for both the circular (rcirc; blue), the moment definition of the radius (rmom; orange) and the deconvolved moment (rmom,deconv; green).
Current usage metrics show cumulative count of Article Views (full-text article views including HTML views, PDF and ePub downloads, according to the available data) and Abstracts Views on Vision4Press platform.
Data correspond to usage on the plateform after 2015. The current usage metrics is available 48-96 hours after online publication and is updated daily on week days.
Initial download of the metrics may take a while.