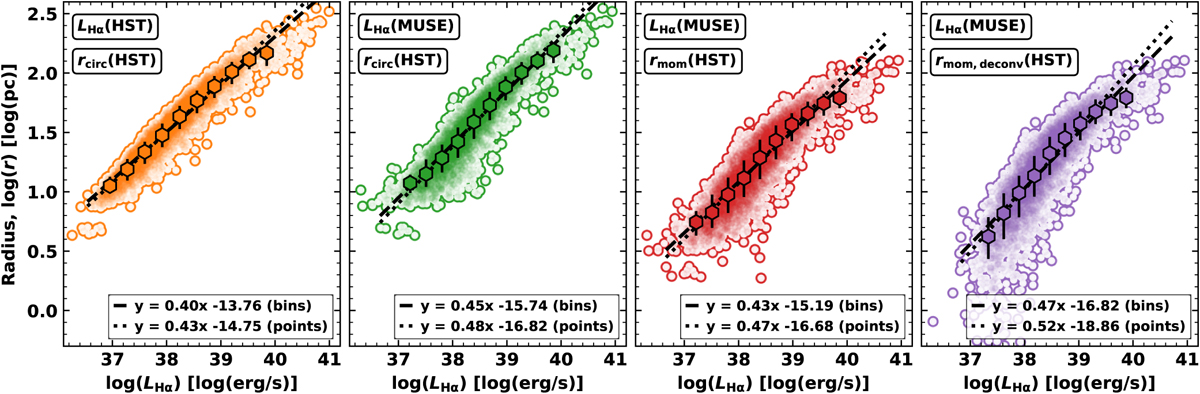
Fig. 9
Download original image
Luminosity-size (log–log) distribution for all galaxies. The distributions of circular radius (rcirc) as a function of luminosity, LHα(HST), measured in the HST images (first panel). The circular (rcirc; second panel), moment (rmom; third panel), deconvolved (rmom,deconv; forth panel) radius from the HST catalogue as a function the luminosity, LHα(MUSE), from the MUSE catalogue. Overlaid are equally spaced binned points (median values of bins shown), with error bars indicating the standard deviation of the points within each bin. Also overlaid are the results of the fitting for the bins and points between the 1 and 99 percentile ranges in both LHα and r (see legend and text for more details).
Current usage metrics show cumulative count of Article Views (full-text article views including HTML views, PDF and ePub downloads, according to the available data) and Abstracts Views on Vision4Press platform.
Data correspond to usage on the plateform after 2015. The current usage metrics is available 48-96 hours after online publication and is updated daily on week days.
Initial download of the metrics may take a while.