Open Access
Fig. 2.
Download original image
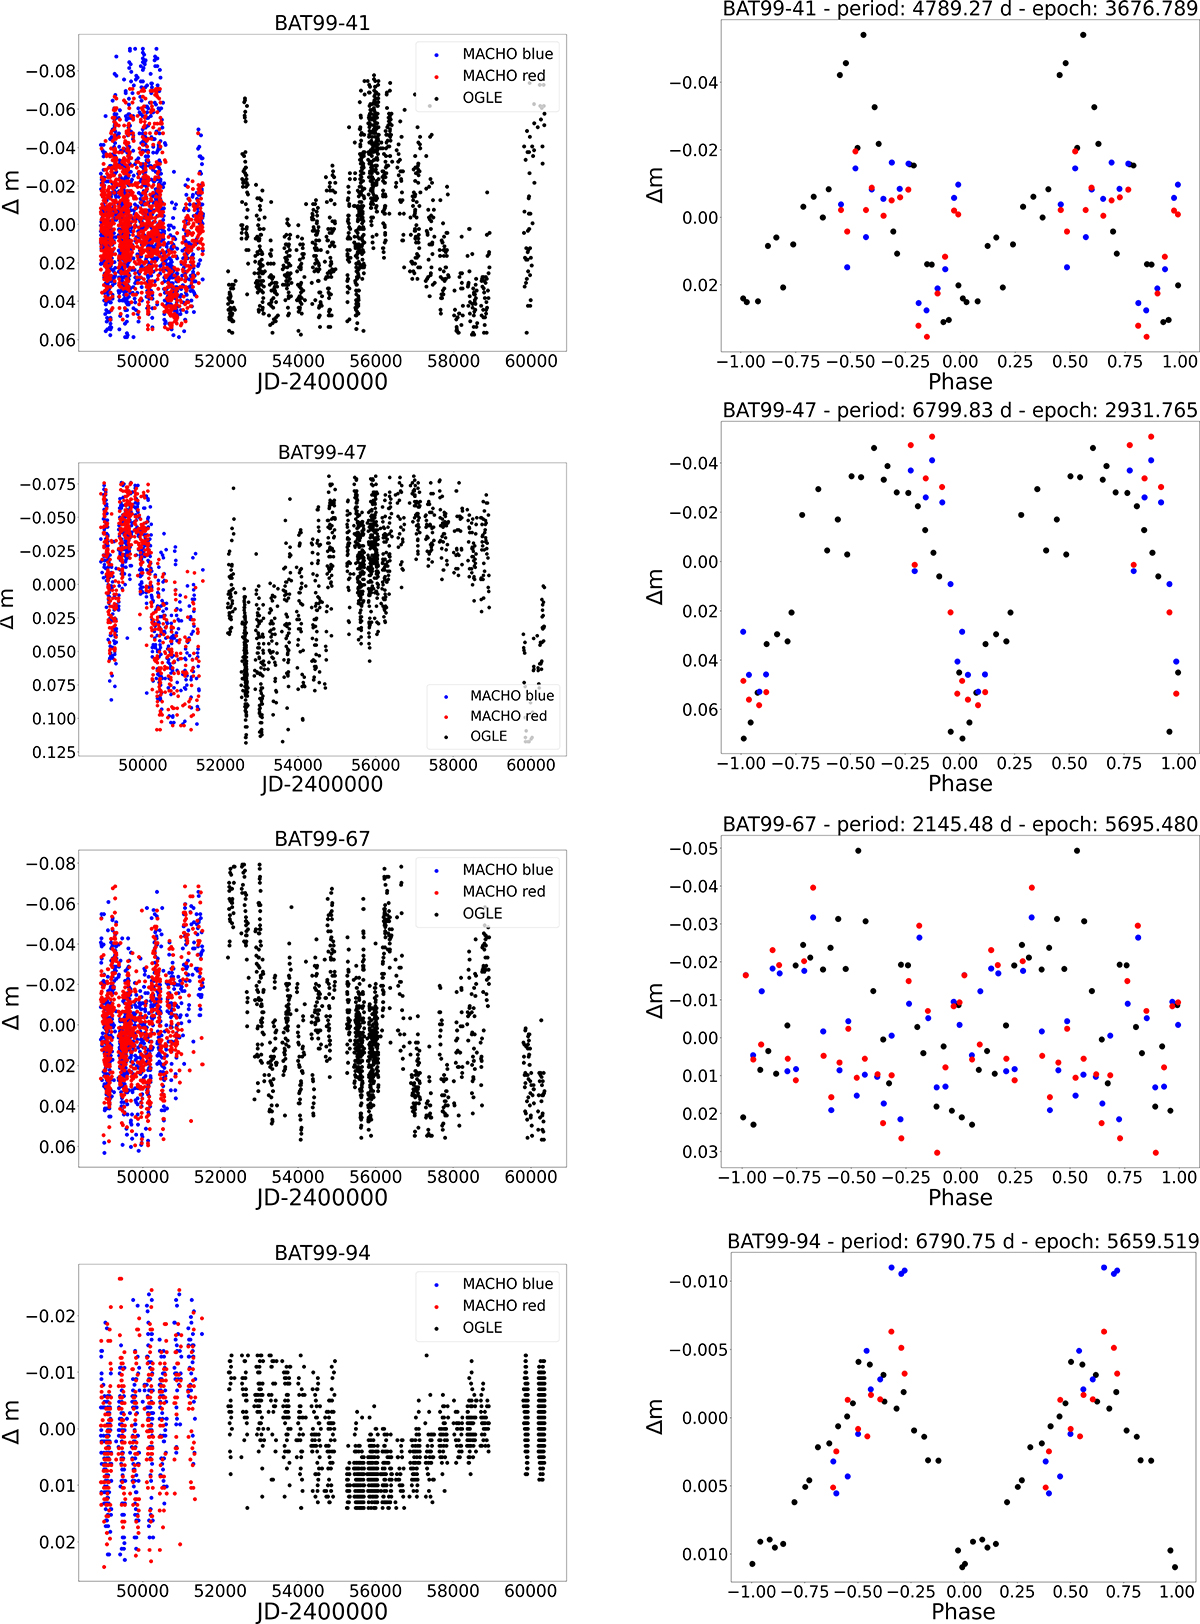
Left column: OGLE (black circles) and MACHO (red and blue circles) light curves showing long-term variability trends. Right column: Binned light curves folded using the OGLE ephemerides from Table C.2. The OGLE light curve is represented in the JD-2400000 instead of HJD-2450000.
Current usage metrics show cumulative count of Article Views (full-text article views including HTML views, PDF and ePub downloads, according to the available data) and Abstracts Views on Vision4Press platform.
Data correspond to usage on the plateform after 2015. The current usage metrics is available 48-96 hours after online publication and is updated daily on week days.
Initial download of the metrics may take a while.