Fig. 4.
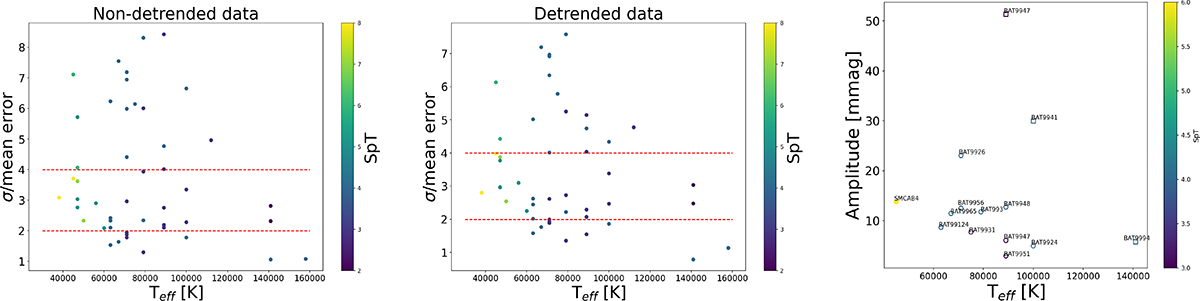
Download original image
Variability level as a function of effective temperature and spectral type for the data before (left) and after (middle panel) detrending. The limits between low, moderate, and high variability levels (Sect. 2.2) are indicated with dashed red lines. The right panel displays the amplitude of variability for 13 WN stars (11 showing short-term variability and 3 long-term) from our sample with significant signals as a function of effective temperature and spectral type. Stars with short periods are marked as circles, and ones with long periods as squares. Empty symbols are used to designate stars with no hydrogen in their spectra; otherwise, they are filled. BAT99-47 exhibits variability on both short and long timescales.
Current usage metrics show cumulative count of Article Views (full-text article views including HTML views, PDF and ePub downloads, according to the available data) and Abstracts Views on Vision4Press platform.
Data correspond to usage on the plateform after 2015. The current usage metrics is available 48-96 hours after online publication and is updated daily on week days.
Initial download of the metrics may take a while.