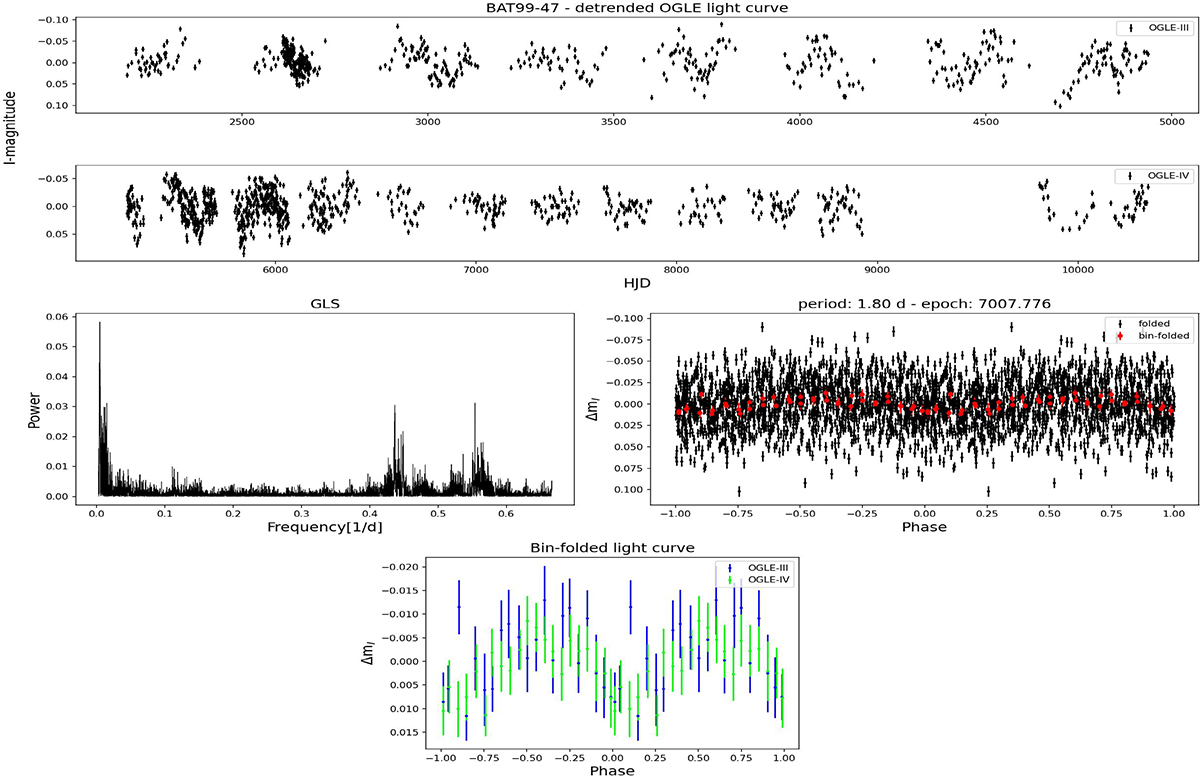
Fig. D.1.
Download original image
BAT99-47. Top panels: Detrended OGLE light curve. Middle-left panel: GLS frequency spectra. Middle-right panel: Light curve phase-folded to the best period found with GLS presented in black. The binned version is superimposed on it and colored in red. Bottom panel: Binned phase-folded light curve, presented in different colors for different OGLE phases.
Current usage metrics show cumulative count of Article Views (full-text article views including HTML views, PDF and ePub downloads, according to the available data) and Abstracts Views on Vision4Press platform.
Data correspond to usage on the plateform after 2015. The current usage metrics is available 48-96 hours after online publication and is updated daily on week days.
Initial download of the metrics may take a while.