Fig. 10.
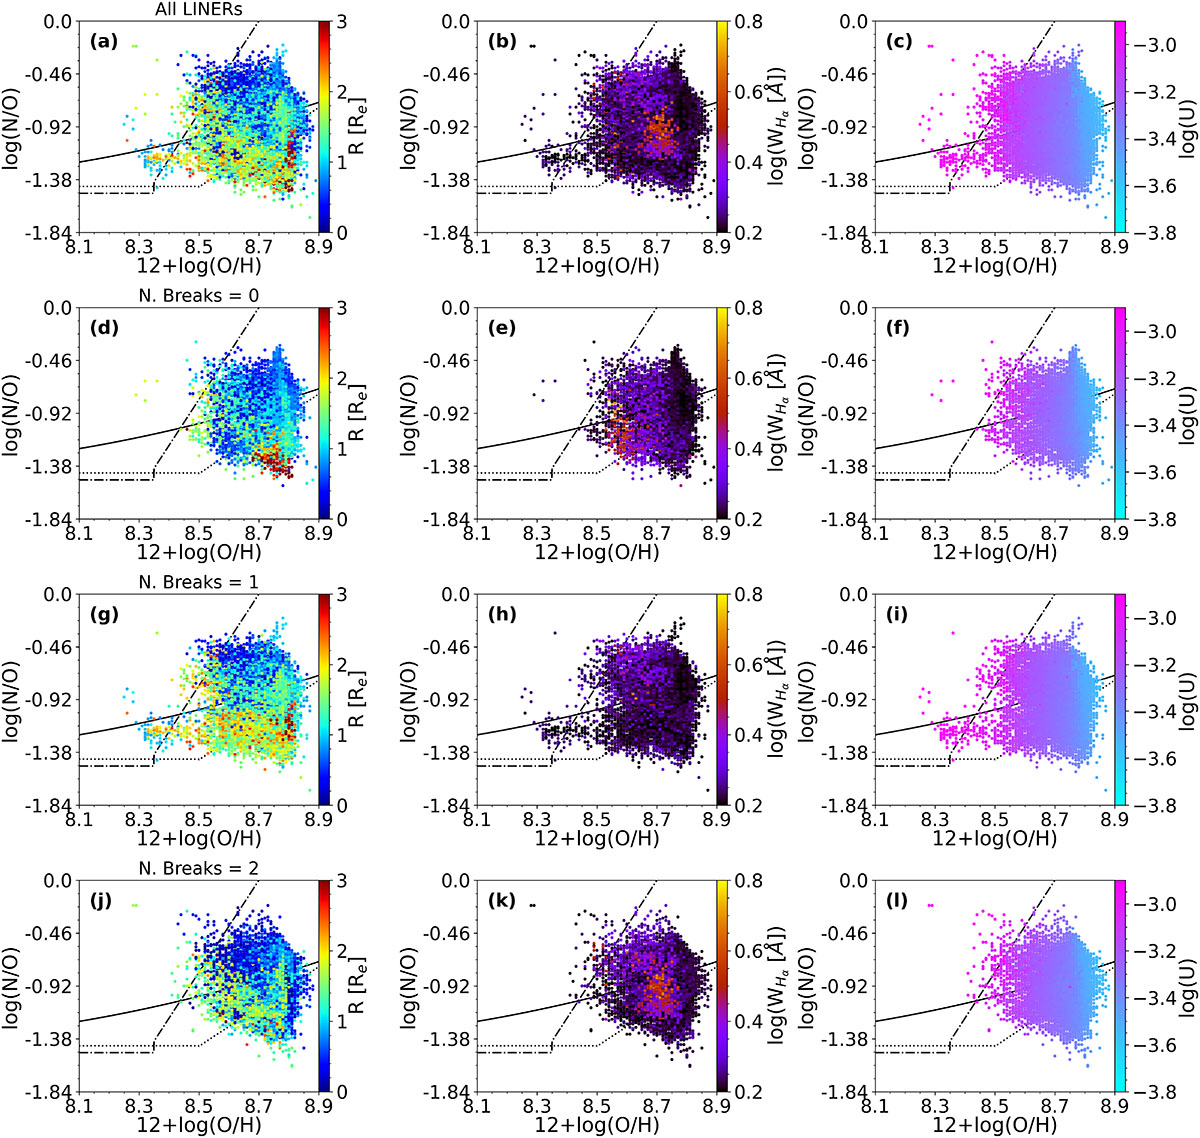
Download original image
Diagram of log(N/O) vs. 12+log(O/H) for the HII regions in our sample of LINERs. From top to bottom, the first row shows diagrams for all HII regions in all LINERs; the second row shows diagrams for those HII regions in LINERs with no breaks in the 12+log(O/H) radial fit; the third row shows diagrams for HII regions in LINERs with one break; and the fourth row shows diagrams for HII regions in LINERs with two breaks. Each column shows different colorbared properties: normalized distance to the galaxy centers (left), equivalent width of Hα (middle) and ionization parameter (right). For all plots, the solid back line represents the fit provided by Coziol et al. (1999), the dotted line shows the fit by Andrews & Martini (2013), and the dash-dotted line shows the fit by Belfiore et al. (2015).
Current usage metrics show cumulative count of Article Views (full-text article views including HTML views, PDF and ePub downloads, according to the available data) and Abstracts Views on Vision4Press platform.
Data correspond to usage on the plateform after 2015. The current usage metrics is available 48-96 hours after online publication and is updated daily on week days.
Initial download of the metrics may take a while.