Fig. 11.
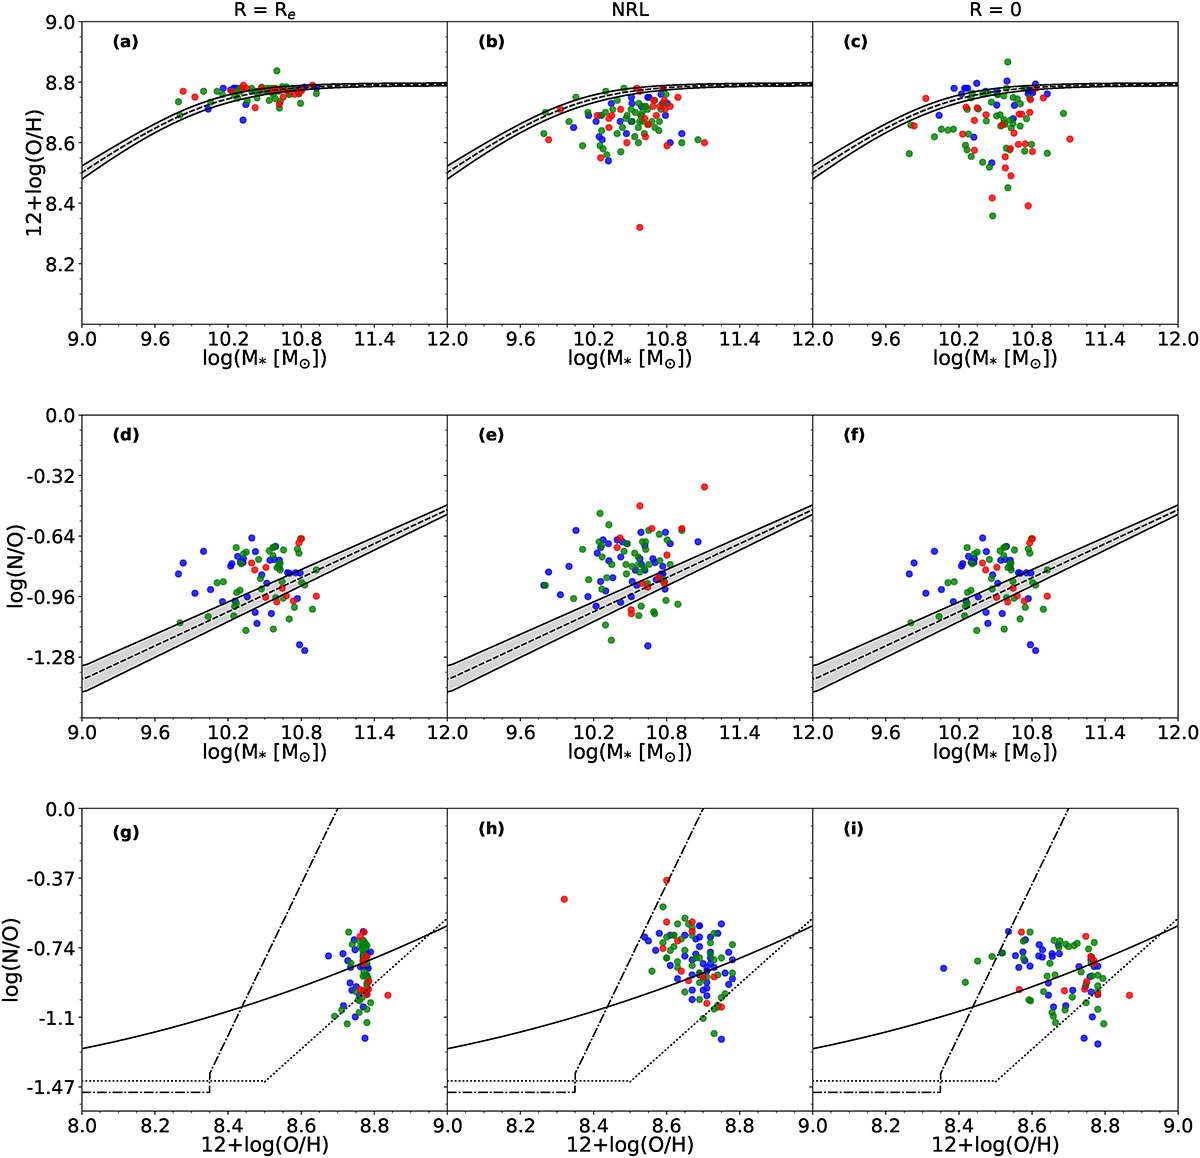
Download original image
Scaling relations for the characteristics of the abundance ratios in our sample of LINER-like galaxies. Panels in the first row show the MZR, and the continuous line represents the fit obtained by Curti et al. (2020). Panels in the second row show the MNOR, with the continuous line representing the fit obtained by Andrews & Martini (2013). Panels in the third row show the log(N/O) vs. 12+log(O/H relation), with the lines representing the different fits explained in Fig. 10. Panels in the first column show the chemical abundance ratios estimated at the effective radius. Panels in the second column show the estimations of nuclear abundances assuming AGN models with αOX = −1.6 (abundance of the Narrow Line Region, NLR). Panels in the third column show the intersects of the metallicity radial fits. For all plots, blue dots represent galaxies with no breaks in their corresponding radial fits, green dots have one break, and red dots represent galaxies with two breaks.
Current usage metrics show cumulative count of Article Views (full-text article views including HTML views, PDF and ePub downloads, according to the available data) and Abstracts Views on Vision4Press platform.
Data correspond to usage on the plateform after 2015. The current usage metrics is available 48-96 hours after online publication and is updated daily on week days.
Initial download of the metrics may take a while.