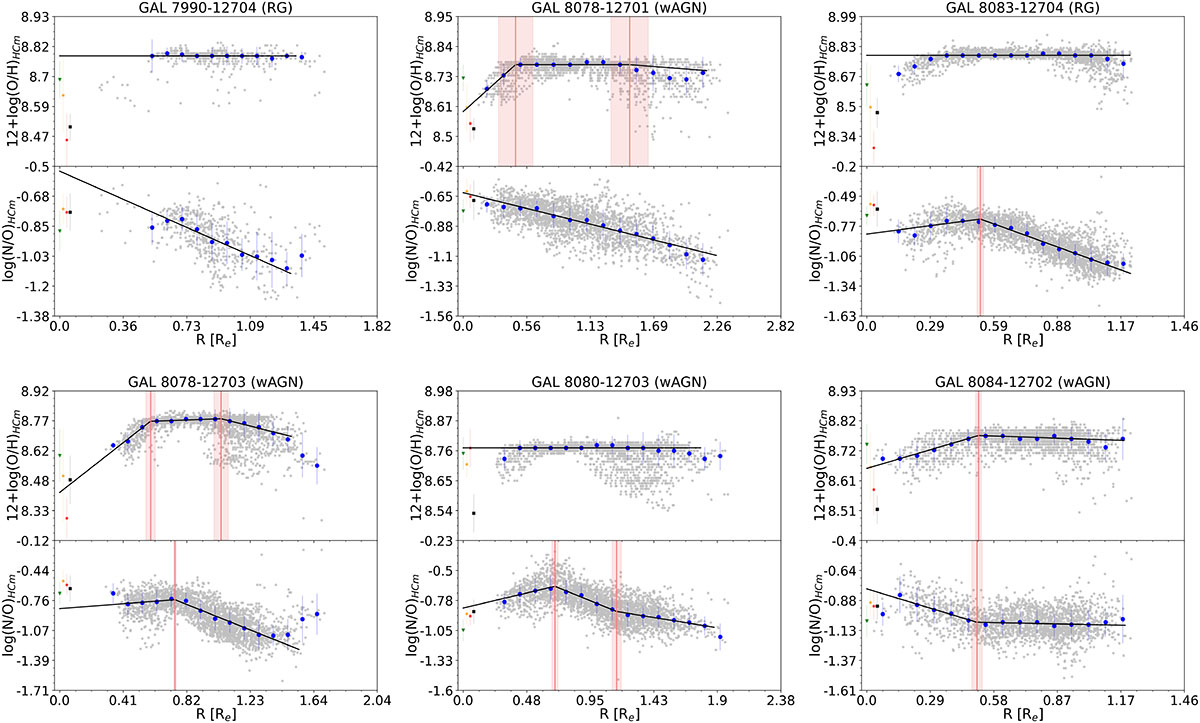
Fig. A.1.
Download original image
Metallicity gradients, 12+log(O/H) and log(N/O), in our sample of LINER-like galaxies. Nuclear estimations of the corresponding chemical abundance ratio are represented as follows: green triangles are the estimations from AGN models with αOX = −1.6; orange and red stars are the estimations from pAGB models with Teff = 105 K and Teff = 1.5 ⋅ 105 K respectively; and black squares are the estimations from ADAF models. Red vertical lines mark the break point, and red shaded areas their corresponding uncertainty.
Current usage metrics show cumulative count of Article Views (full-text article views including HTML views, PDF and ePub downloads, according to the available data) and Abstracts Views on Vision4Press platform.
Data correspond to usage on the plateform after 2015. The current usage metrics is available 48-96 hours after online publication and is updated daily on week days.
Initial download of the metrics may take a while.