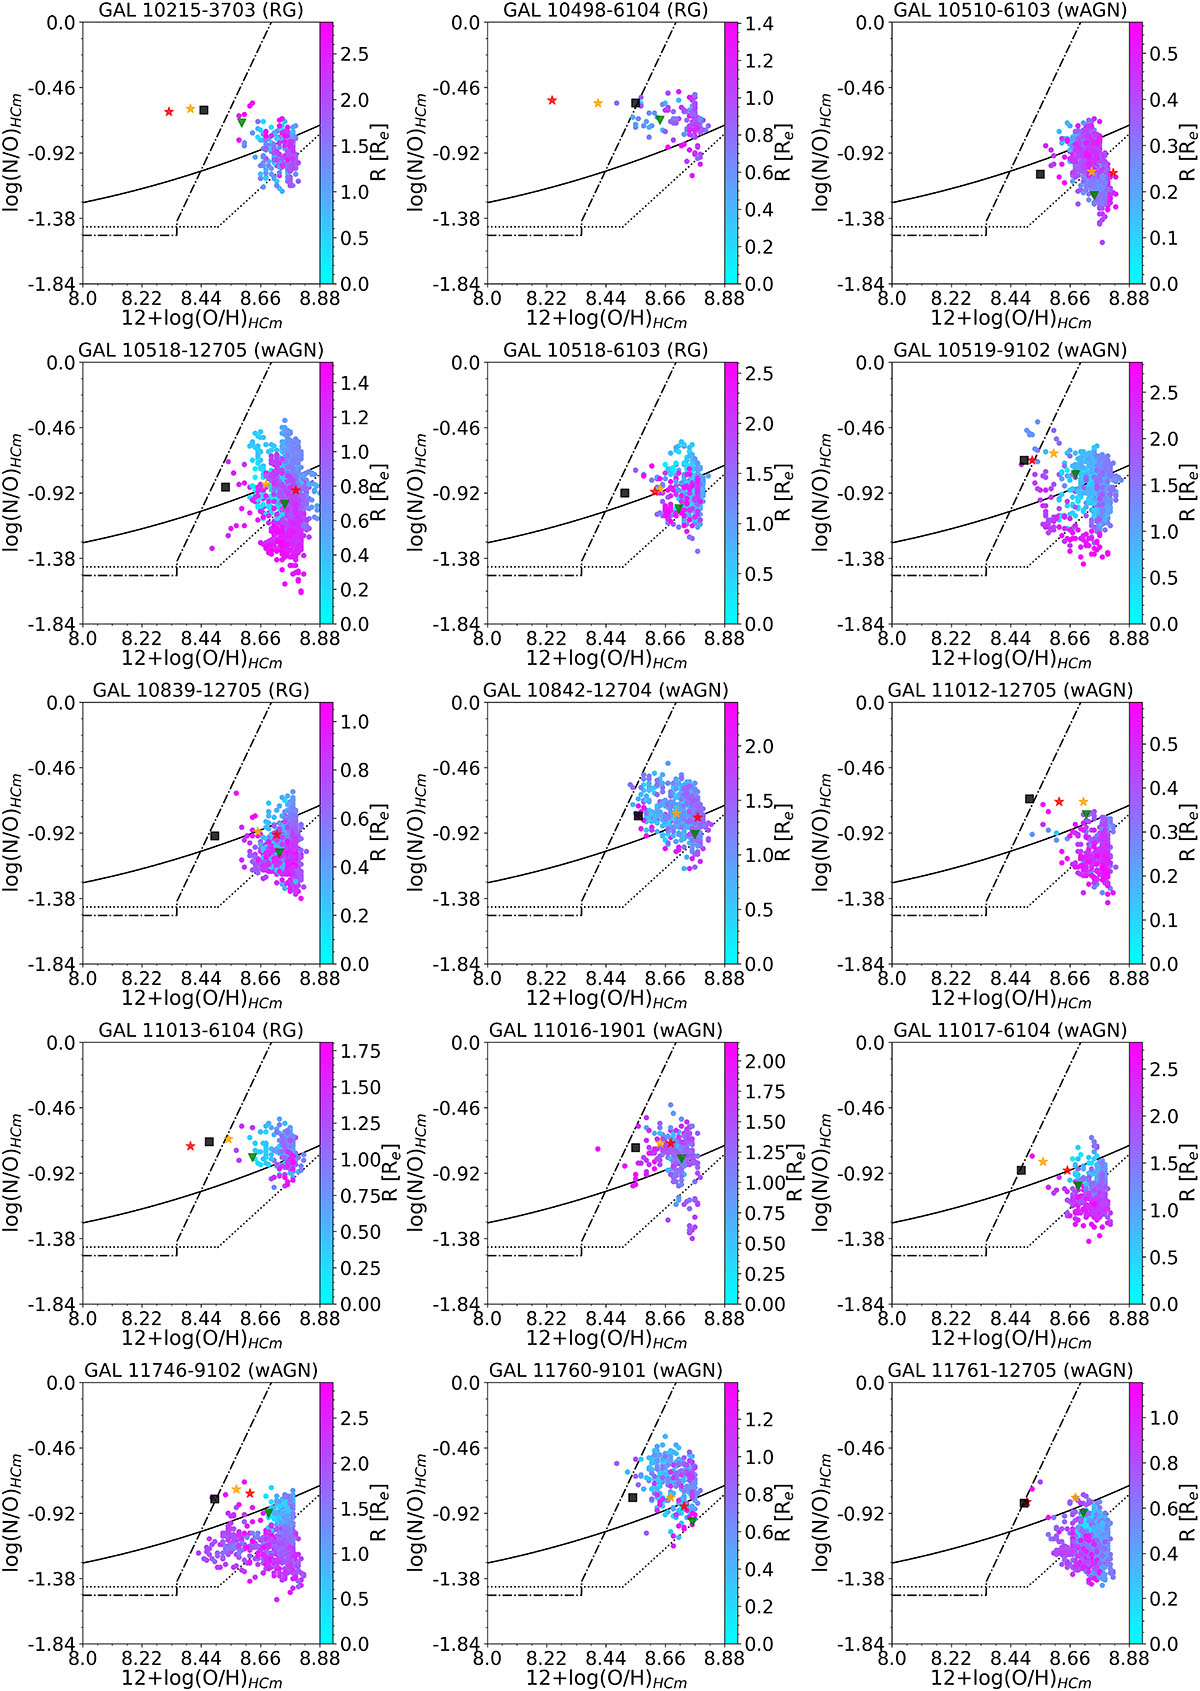
Fig. B.1.
Download original image
Diagram of log(N/O) vs. 12+log(O/H) for the HII regions in our sample of LINERs. The colorbar shows the distance to the galactic center in terms of R50. Nuclear estimations of the corresponding chemical abundance ratio are represented as follows: green triangles are the estimations from AGN models with αOX = −1.6; orange and red stars are the estimations from pAGB models with Teff = 105 K and Teff = 1.5 ⋅ 105 K respectively; and black squares are the estimations from ADAF models. The solid back line represents the fit provided by Coziol et al. (1999), the dotted line shows the fit by Andrews & Martini (2013), and the dash-dotted line shows the fit by (Belfiore et al. 2015).
Current usage metrics show cumulative count of Article Views (full-text article views including HTML views, PDF and ePub downloads, according to the available data) and Abstracts Views on Vision4Press platform.
Data correspond to usage on the plateform after 2015. The current usage metrics is available 48-96 hours after online publication and is updated daily on week days.
Initial download of the metrics may take a while.