Fig. 2.
Download original image
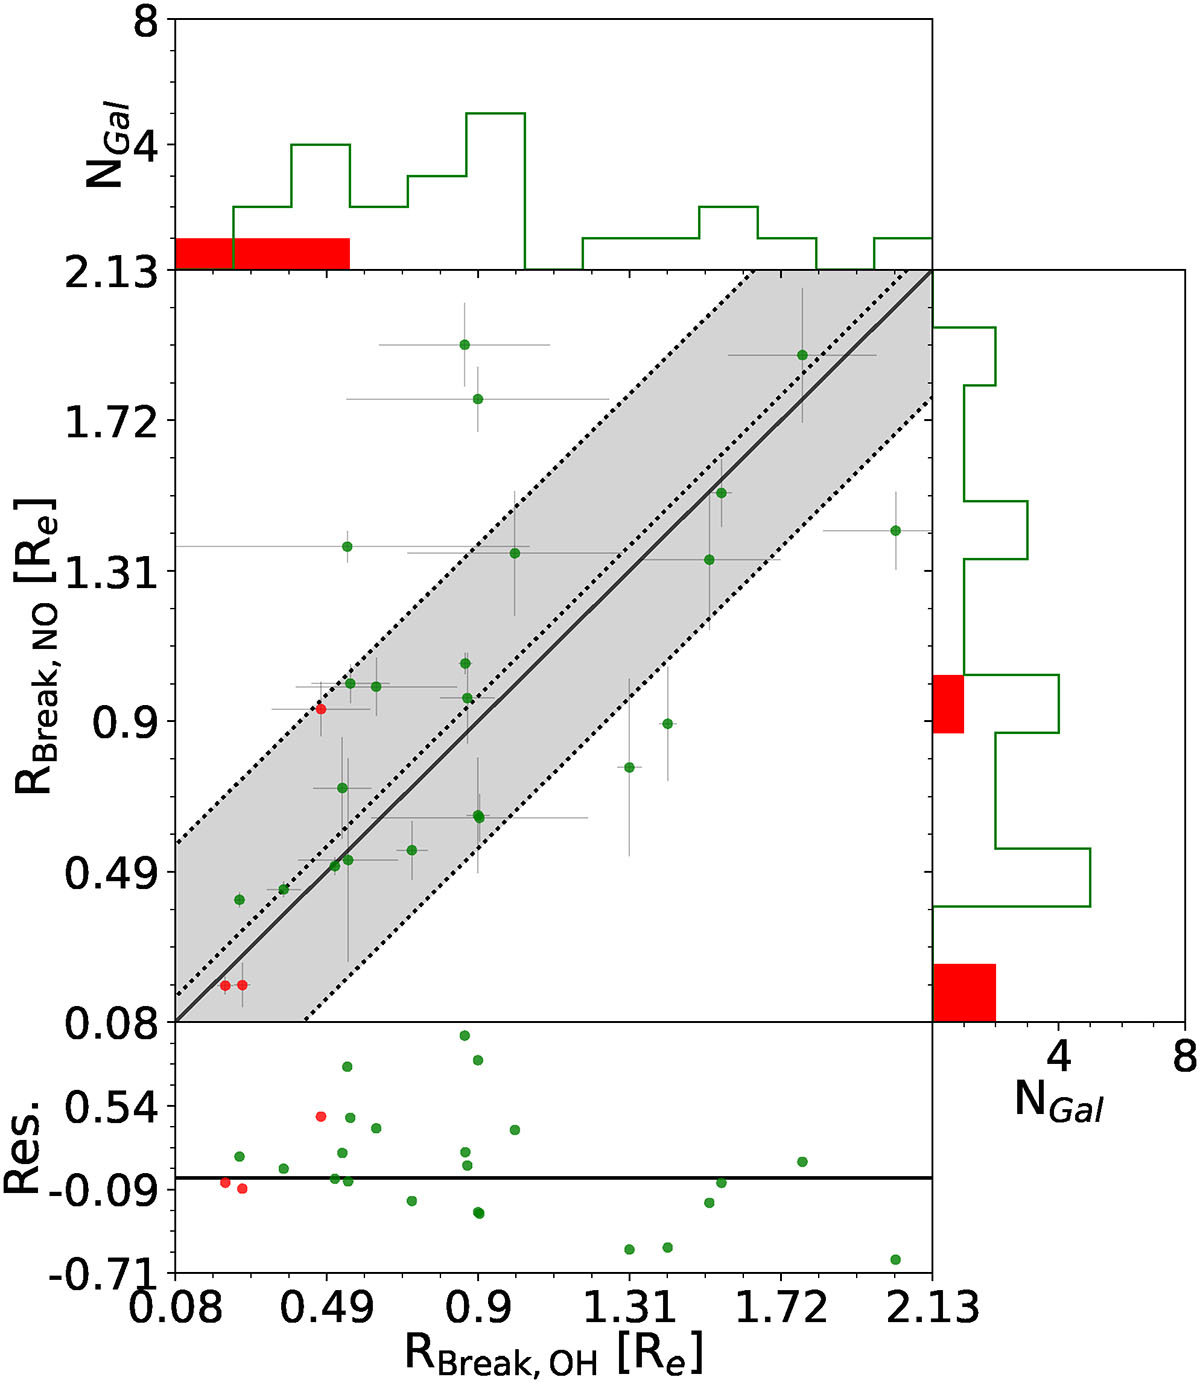
Comparison between the breaks found for the log(N/O) radial gradients (y-axis) and 12+log(O/H) radial gradients (x-axis) in our sample. Green dots correspond to LINERs showing one break in both gradients, whereas red dots correspond to LINERs showing two breaks. The solid black lines represent the one-to-one relation, the dotted lines represent the median offset, and the shaded gray area the deviation.
Current usage metrics show cumulative count of Article Views (full-text article views including HTML views, PDF and ePub downloads, according to the available data) and Abstracts Views on Vision4Press platform.
Data correspond to usage on the plateform after 2015. The current usage metrics is available 48-96 hours after online publication and is updated daily on week days.
Initial download of the metrics may take a while.