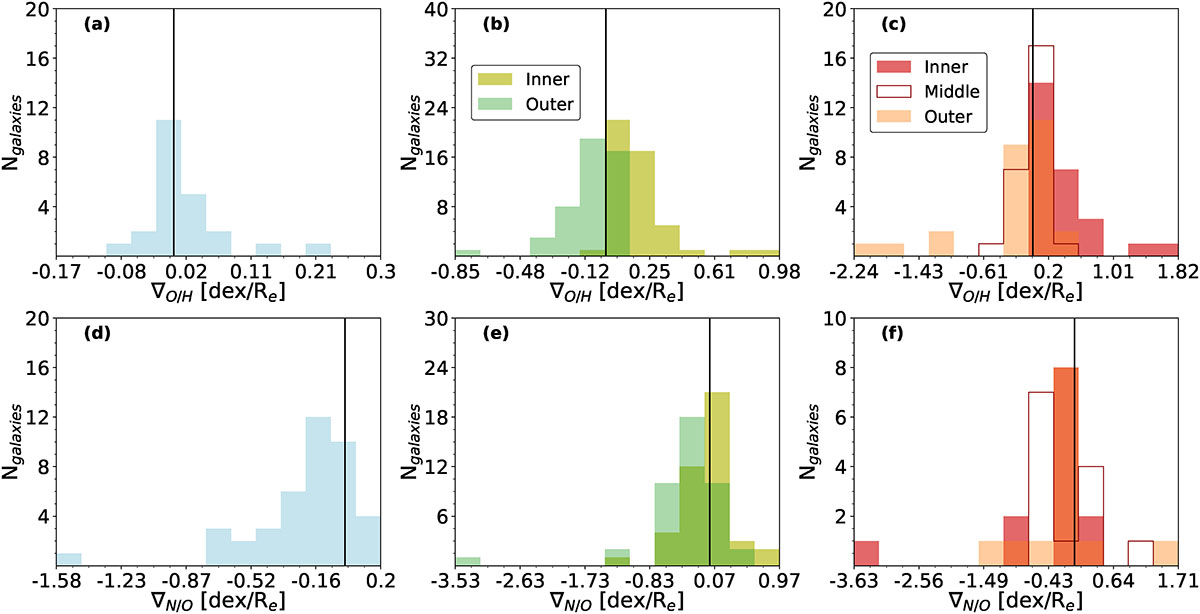
Fig. 3.
Download original image
Histogram of the obtained gradient slopes in the fits for both 12+log(O/H) and log(N/O) for different categories attending to the number of obtained breaks. Slopes for 12+log(O/H): a) galaxies with no breaks, b) galaxies with one single break, and c) galaxies with two breaks. The lower plots d), e), and f) are similar to the above ones but are for the log(N/O) radial gradient. For all plots, solid black lines represent the flattened profile (∇ = 0).
Current usage metrics show cumulative count of Article Views (full-text article views including HTML views, PDF and ePub downloads, according to the available data) and Abstracts Views on Vision4Press platform.
Data correspond to usage on the plateform after 2015. The current usage metrics is available 48-96 hours after online publication and is updated daily on week days.
Initial download of the metrics may take a while.