Fig. 4.
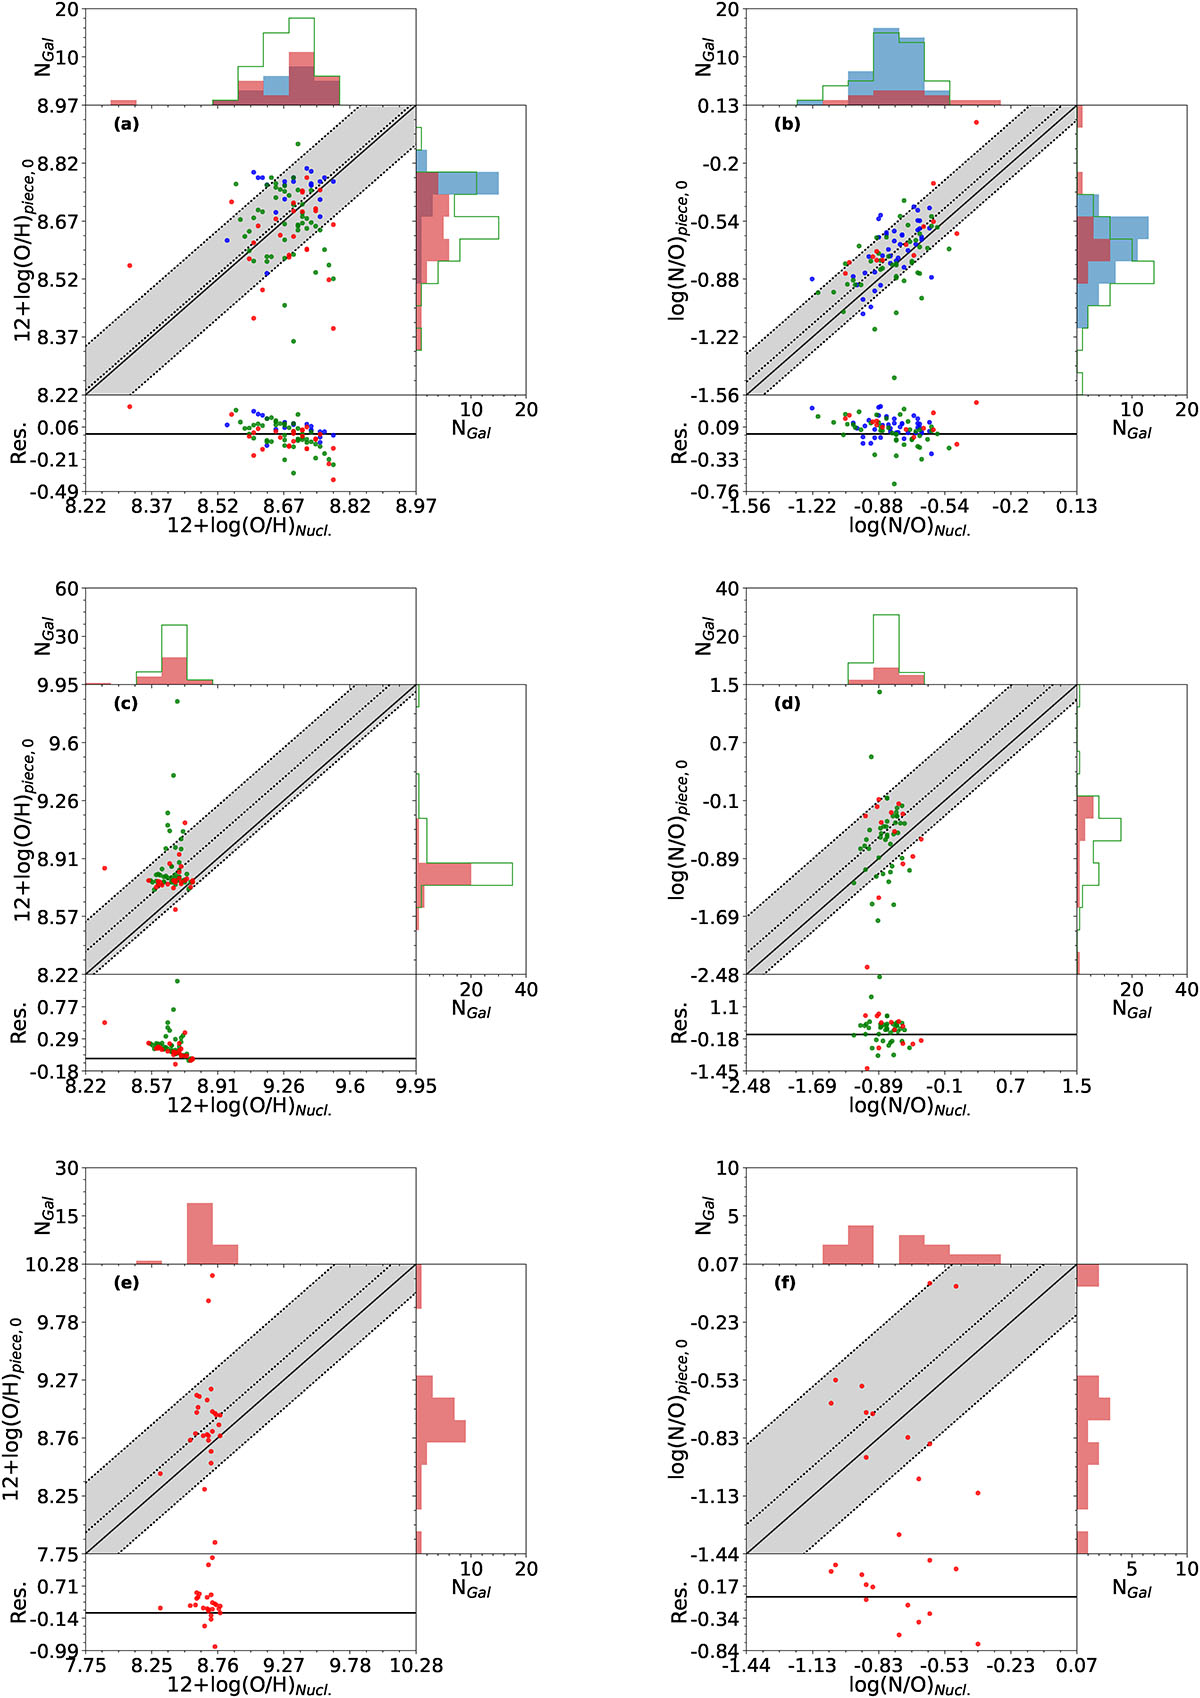
Download original image
Comparison of the abundances obtained as intersects from the fits with the abundances estimated in the nuclear regions both for 12+log(O/H) (left column) and log(N/O) (right column). Plots a) and b) represent the extrapolation of the innermost radial fits, while plots c) and d) represent the extrapolation of the middle radial fits, and plots e) and f) the extrapolations of the outer radial fits. For all plots, Blue dots represent galaxies with no breaks in their corresponding fits, green dots galaxies with one break, and red dots galaxies with two breaks. The solid black lines represent the one-to-one relation, the dotted lines represent the median offset, and the shaded gray areas the deviation.
Current usage metrics show cumulative count of Article Views (full-text article views including HTML views, PDF and ePub downloads, according to the available data) and Abstracts Views on Vision4Press platform.
Data correspond to usage on the plateform after 2015. The current usage metrics is available 48-96 hours after online publication and is updated daily on week days.
Initial download of the metrics may take a while.