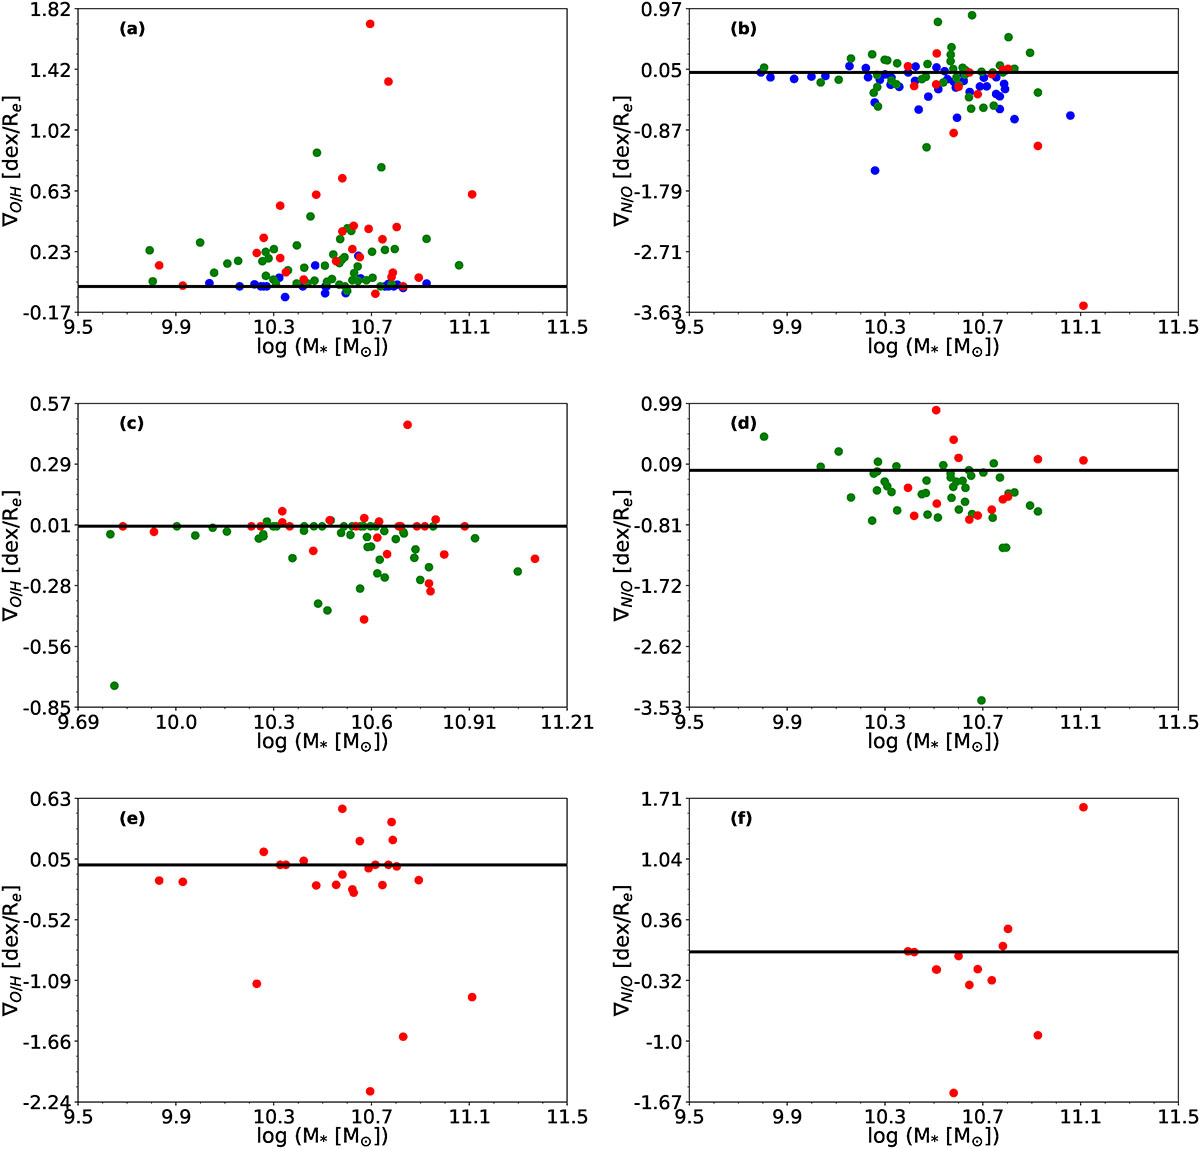
Fig. 5.
Download original image
Relation between stellar mass and the slopes for the radial fits of 12+log(O/H) (left column) and log(N/O) (right column). Panels a) and b) represent the slopes of the inner radial fits, panels c) and d) show the slopes of the middle radial fits, and panels e) and f) present the slopes of the outer radial fits. For all plots, blue dots represent galaxies with no breaks, green dots are for those with one break, and red dots represent galaxies with two breaks. Solid black lines represent the flattened profile (∇ = 0).
Current usage metrics show cumulative count of Article Views (full-text article views including HTML views, PDF and ePub downloads, according to the available data) and Abstracts Views on Vision4Press platform.
Data correspond to usage on the plateform after 2015. The current usage metrics is available 48-96 hours after online publication and is updated daily on week days.
Initial download of the metrics may take a while.