Open Access
Fig. 9.
Download original image
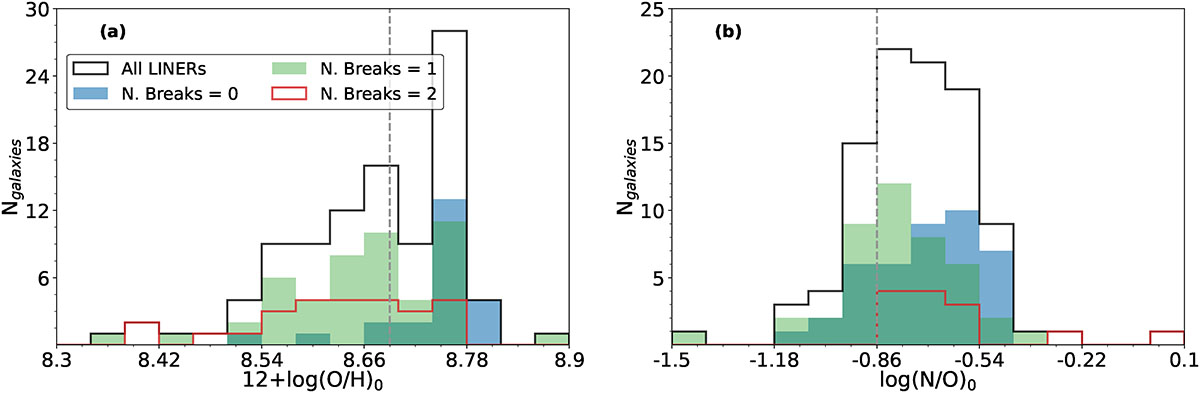
Histogram of the intersects of the inner parts of the metallicity radial fits for (a) 12+log(O/H), and (b) for log(N/O). The sample of LINERs is segregated into three groups according to the number of breaks shown in the abundance radial gradient. For both plots, gray dashed lines correspond to the solar value.
Current usage metrics show cumulative count of Article Views (full-text article views including HTML views, PDF and ePub downloads, according to the available data) and Abstracts Views on Vision4Press platform.
Data correspond to usage on the plateform after 2015. The current usage metrics is available 48-96 hours after online publication and is updated daily on week days.
Initial download of the metrics may take a while.