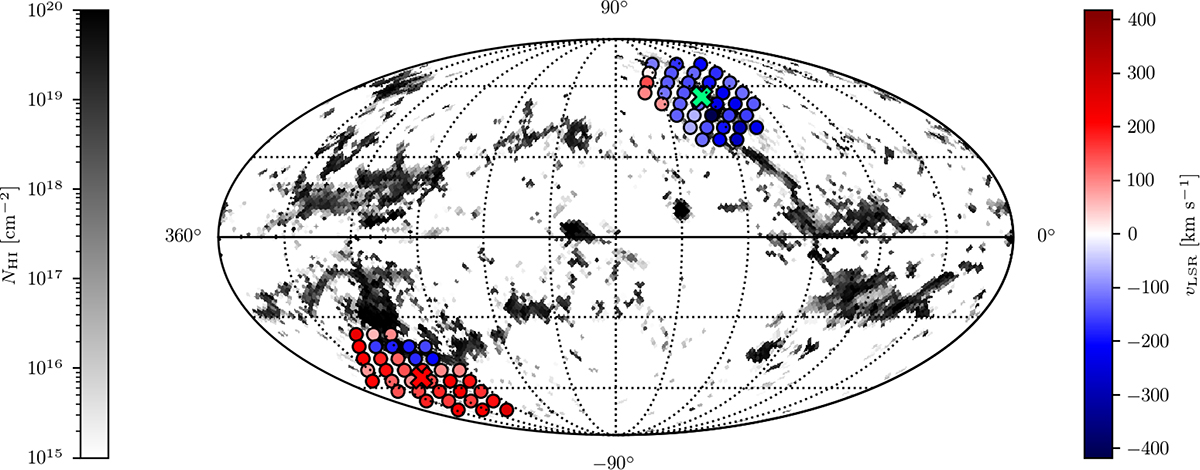
Fig. 1.
Download original image
Column density map of H I high-velocity clouds in simulation 17_11, as seen by a simulated observer from the Sun’s position. Colour-coded LSR gas velocities in sightlines evenly spread towards the general barycentre (green cross) and anti-barycentre (red cross) directions are also shown. Galactic longitude increases from right to left.
Current usage metrics show cumulative count of Article Views (full-text article views including HTML views, PDF and ePub downloads, according to the available data) and Abstracts Views on Vision4Press platform.
Data correspond to usage on the plateform after 2015. The current usage metrics is available 48-96 hours after online publication and is updated daily on week days.
Initial download of the metrics may take a while.