Fig. A.2.
Download original image
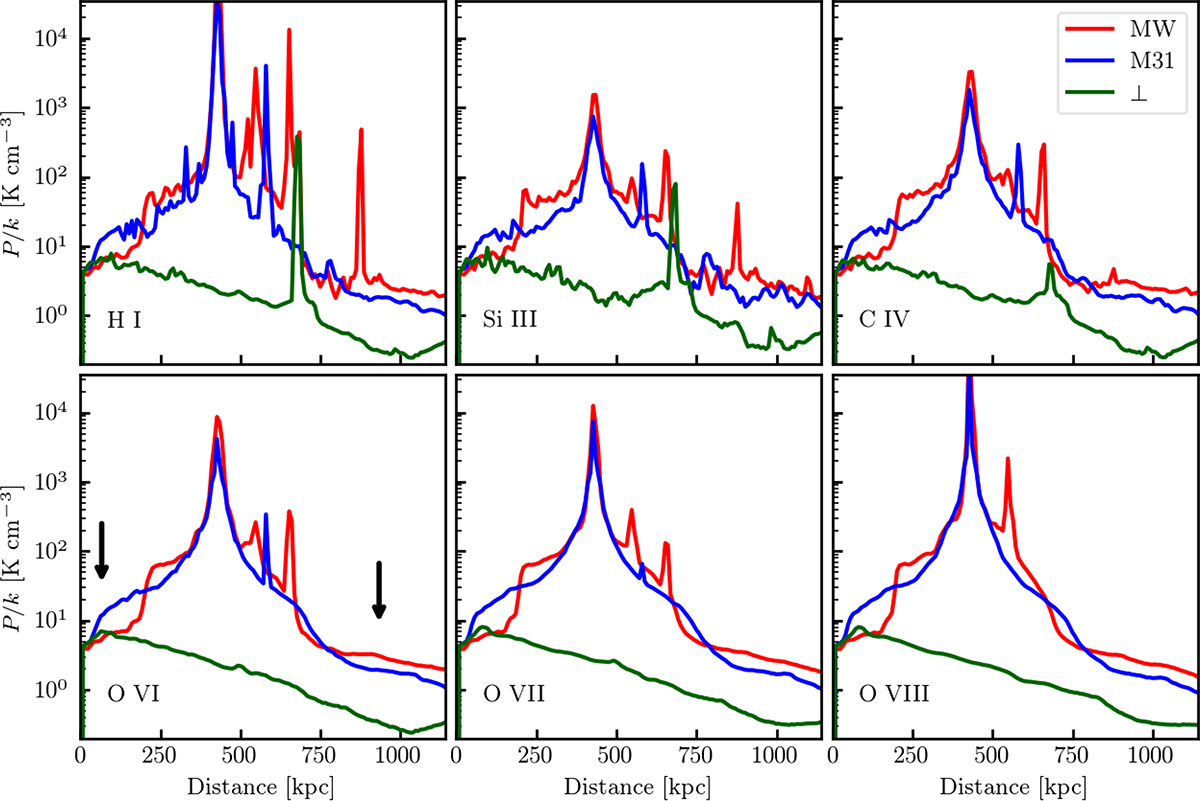
Gas pressure profile of the different ionic species for Local Group realisation 9_18 measured from the midpoint between the MW and M31 in different directions. The solid lines show profiles pointing towards the MW (red), M31 (blue) and averaging over many directions perpendicular to the radial vector joining the two galaxies (green). Note that the two peaks seen at r ∼ 400 kpc in the red and blue lines correspond to the MW and M31 haloes. Arrows indicate locations in front (left) and behind (right) the MW candidate.
Current usage metrics show cumulative count of Article Views (full-text article views including HTML views, PDF and ePub downloads, according to the available data) and Abstracts Views on Vision4Press platform.
Data correspond to usage on the plateform after 2015. The current usage metrics is available 48-96 hours after online publication and is updated daily on week days.
Initial download of the metrics may take a while.