Fig. 2.
Download original image
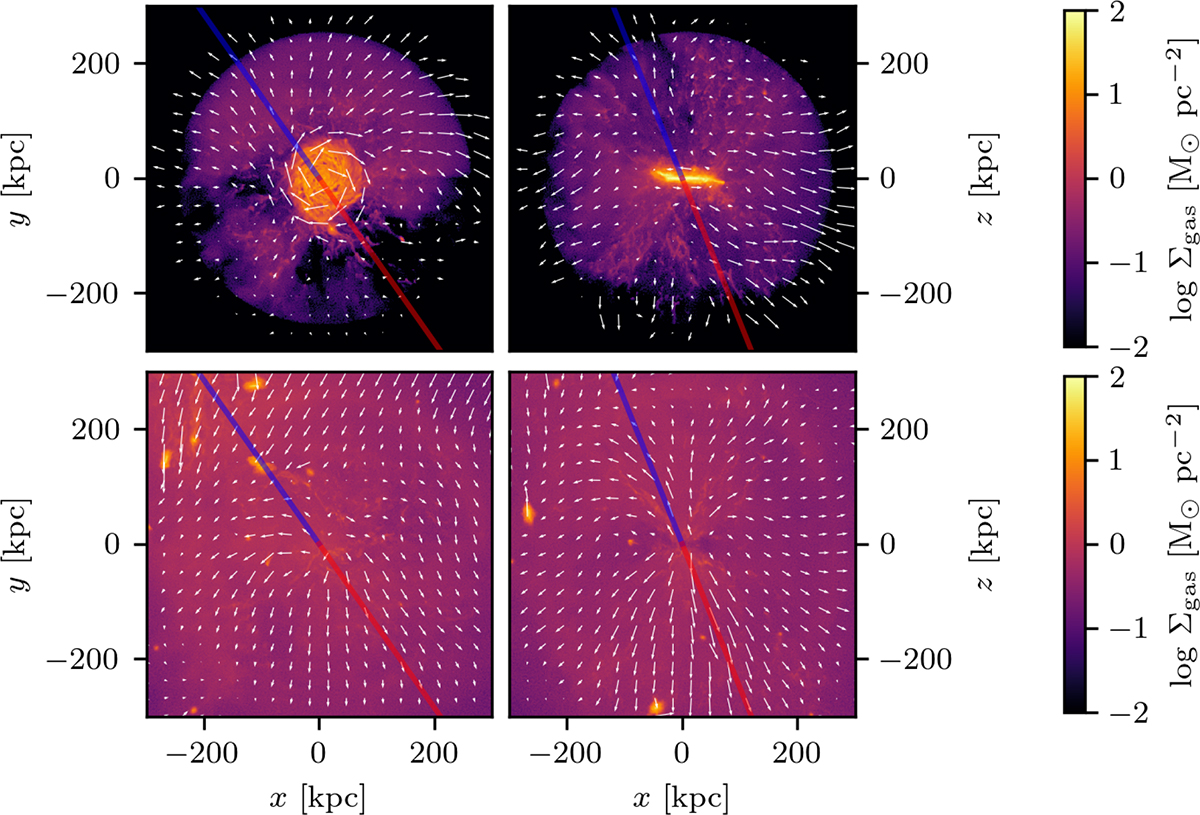
Gas distribution at z = 0 obtained after applying the kinematic filtering method described in Section 3.2 for the MW candidate in LG simulation 17_11 for face-on (left panels) and edge-on (right panels) views. The upper (lower) panels show material consistent (inconsistent) with disc-like velocities according to the adopted filter. The velocity field of gas in all panels is indicated by the white arrows. The blue and red solid lines in all panels indicate the barycentre and anti-barycentre directions, respectively.
Current usage metrics show cumulative count of Article Views (full-text article views including HTML views, PDF and ePub downloads, according to the available data) and Abstracts Views on Vision4Press platform.
Data correspond to usage on the plateform after 2015. The current usage metrics is available 48-96 hours after online publication and is updated daily on week days.
Initial download of the metrics may take a while.