Fig. 5.
Download original image
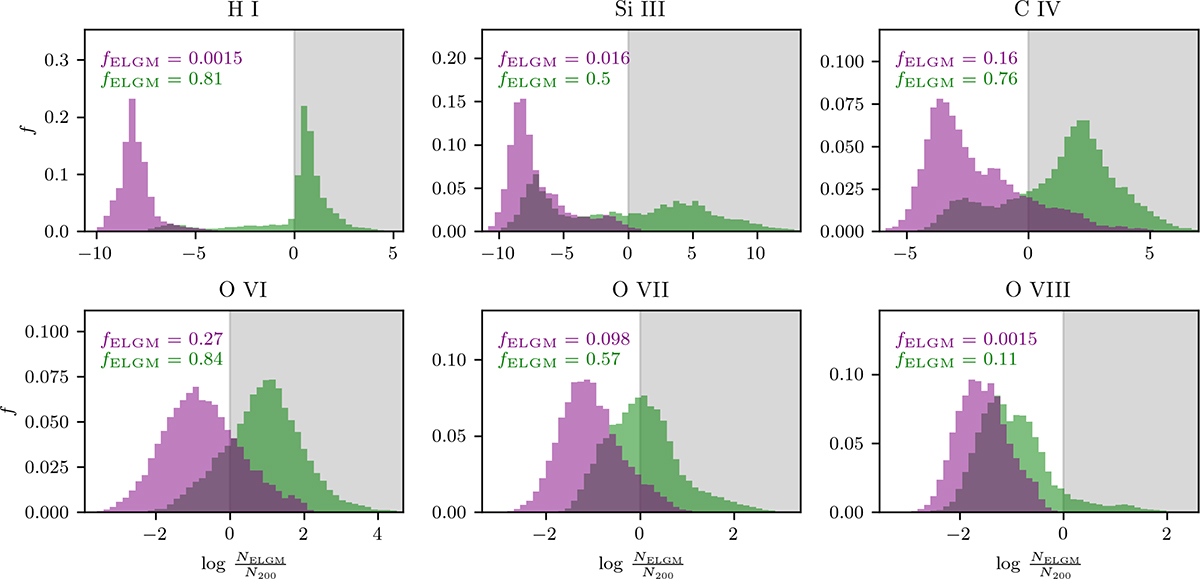
Distribution of column density ratio NELGM/N200 for the six studied ions, for a sample of sightlines covering the simulated sky of simulation 17_11 uniformly. Purple histograms correspond to distributions for all material within and outside the CGM of the MW candidate, while green histograms show the distributions after material with disc-like motion within R200 has been filtered out using the method described in Sect. 3.2. The fraction of sightlines with column density ratio NELGM/N200 > 1 (grey shaded area), noted as fELGM, is indicated in all panels for each histogram.
Current usage metrics show cumulative count of Article Views (full-text article views including HTML views, PDF and ePub downloads, according to the available data) and Abstracts Views on Vision4Press platform.
Data correspond to usage on the plateform after 2015. The current usage metrics is available 48-96 hours after online publication and is updated daily on week days.
Initial download of the metrics may take a while.