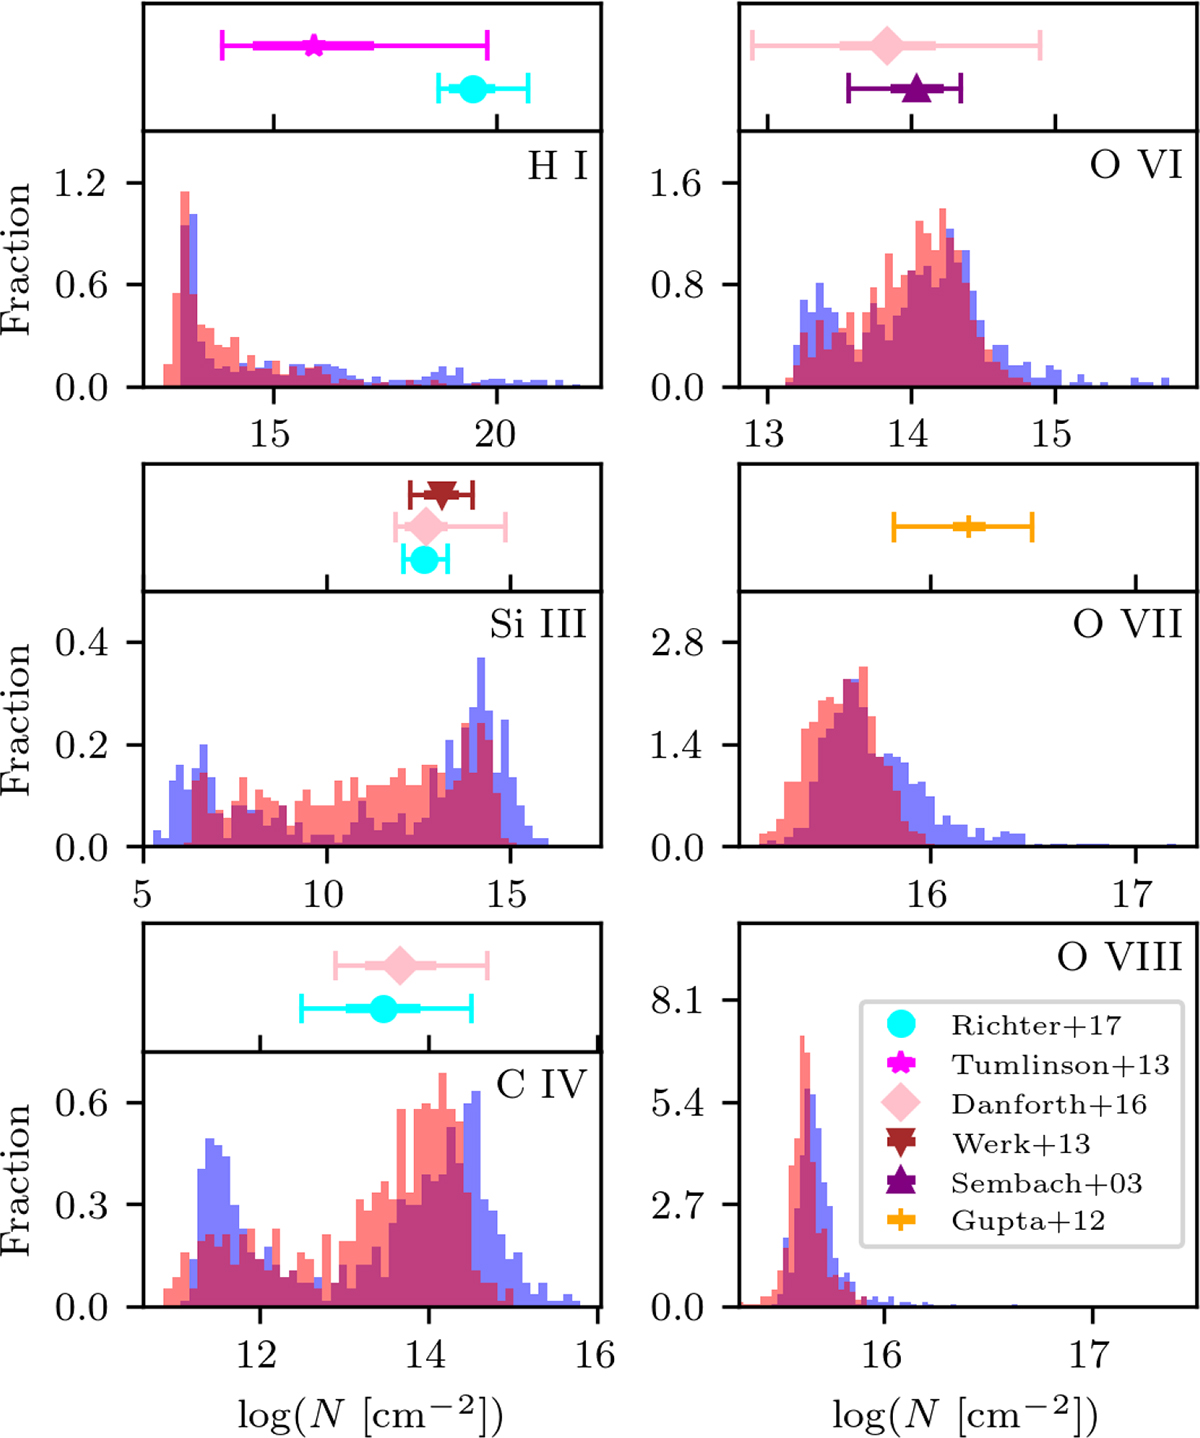
Fig. 6.
Download original image
Column density distributions for the six different ions studied in realisation 17_11, excluding material with motion consistent with disc rotation. Distributions for sightlines in the barycentre and anti-barycentre direction are shown in blue and red, respectively. The error bars in the upper panels indicate mean and standard deviation, with whiskers extending up to minimum and maximum observed values in the MW halo, external galaxies and the low-redshift intergalactic medium (see text).
Current usage metrics show cumulative count of Article Views (full-text article views including HTML views, PDF and ePub downloads, according to the available data) and Abstracts Views on Vision4Press platform.
Data correspond to usage on the plateform after 2015. The current usage metrics is available 48-96 hours after online publication and is updated daily on week days.
Initial download of the metrics may take a while.