Open Access
Fig. 5.
Download original image
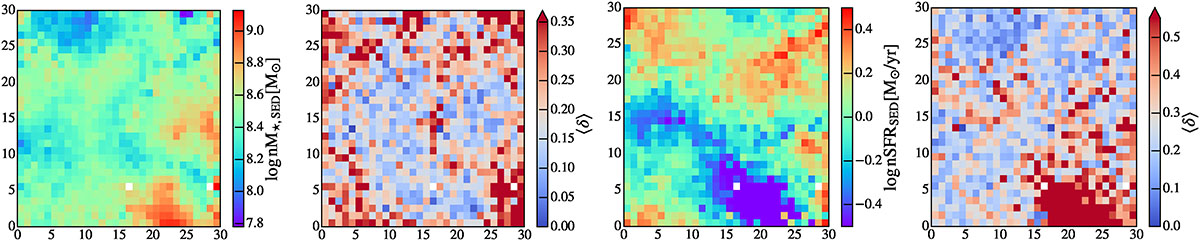
Label maps of normalized stellar mass and SFR. For each pair, the left panel displays the SOM grid color-coded by the mode of the corresponding parameter (stellar mass or SFR), while the right panel shows the distribution width, defined as the 84th–16th percentile range ⟨δ⟩=⟨84%−16%⟩, within each cell.
Current usage metrics show cumulative count of Article Views (full-text article views including HTML views, PDF and ePub downloads, according to the available data) and Abstracts Views on Vision4Press platform.
Data correspond to usage on the plateform after 2015. The current usage metrics is available 48-96 hours after online publication and is updated daily on week days.
Initial download of the metrics may take a while.