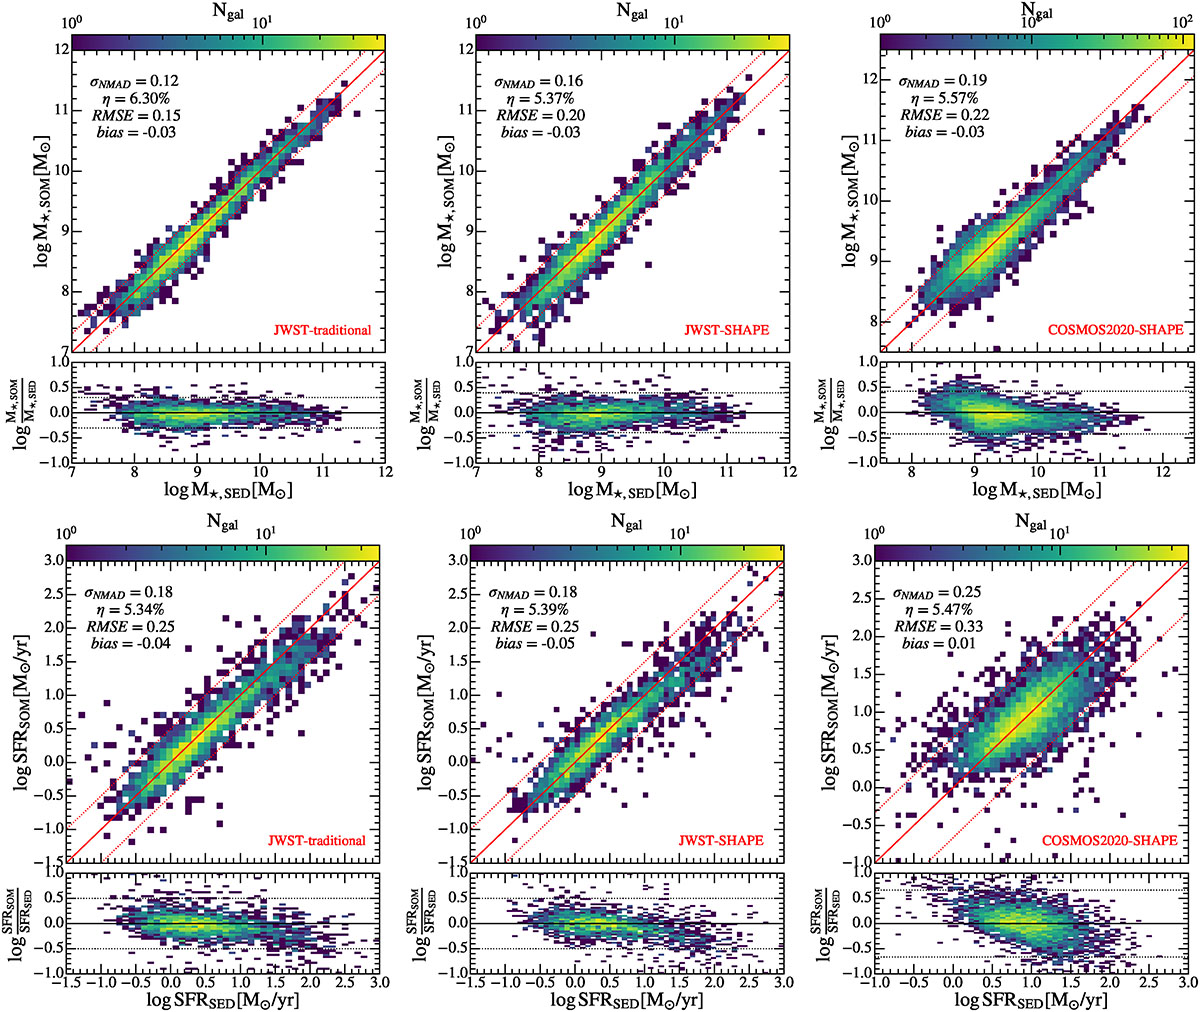
Fig. 6.
Download original image
Comparison between stellar mass, M★, and SFR obtained through standard template fitting (XSED) and different SOM-based methods presented in this work (XSOM, with the specific model highlighted in red in the lower right corner). From left to right, the panels show the application of the traditional SOM method to the 7:3 JWST sample, the application of the 25 × 25 hybrid method to the 7:3 JWST sample, and the application of the 30 × 30 hybrid method to the COSMOS2020 sample. The solid red line represents the bisection line, while the red dashed lines indicate the boundaries of the outlier.
Current usage metrics show cumulative count of Article Views (full-text article views including HTML views, PDF and ePub downloads, according to the available data) and Abstracts Views on Vision4Press platform.
Data correspond to usage on the plateform after 2015. The current usage metrics is available 48-96 hours after online publication and is updated daily on week days.
Initial download of the metrics may take a while.