Fig. 7.
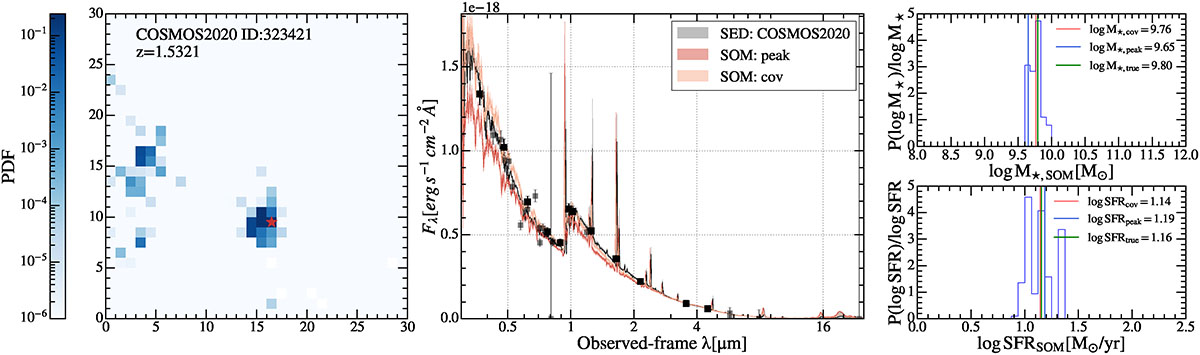
Download original image
Example of parameter estimation using SHAPE. Left: Probability distribution of galaxy ID323421. The target is mapped onto this surface according to the likelihood, with the red star marking the best-matching grid. Middle: Comparison between the SEDs obtained via SED Lib matching (dark and light red) and the synthetic templates (black). The shaded regions represent the 16th − 84th uncertainty range. Black dots with error bars denote the photometric points used as input (u, g, r, i, z, y, Y, J, H, Ks, ch1, and ch2), while transparent dots represent additional bands used in SED fitting but not included in SOM. Right: Probability distribution of parameter estimates. The vertical red line represents the estimates obtained by convolving the probability distribution with the label maps, the blue line represents the estimate from the best-matching cell, and the green line corresponds to the SED fitting result.
Current usage metrics show cumulative count of Article Views (full-text article views including HTML views, PDF and ePub downloads, according to the available data) and Abstracts Views on Vision4Press platform.
Data correspond to usage on the plateform after 2015. The current usage metrics is available 48-96 hours after online publication and is updated daily on week days.
Initial download of the metrics may take a while.