Open Access
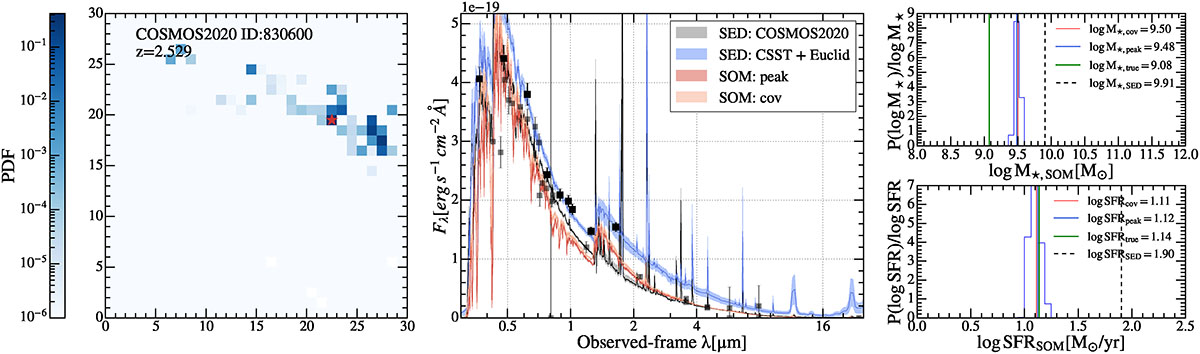
Fig. 9.
Download original image
Similar to Fig. 7, but using only the u, g, r, i, z, y, Y, J, H bands in SOM. The blue line in the middle panel represents the synthetic templates obtained using the same nine-band photometry. The dashed lines in the right panel correspond to the nine-band SED fitting estimates.
Current usage metrics show cumulative count of Article Views (full-text article views including HTML views, PDF and ePub downloads, according to the available data) and Abstracts Views on Vision4Press platform.
Data correspond to usage on the plateform after 2015. The current usage metrics is available 48-96 hours after online publication and is updated daily on week days.
Initial download of the metrics may take a while.