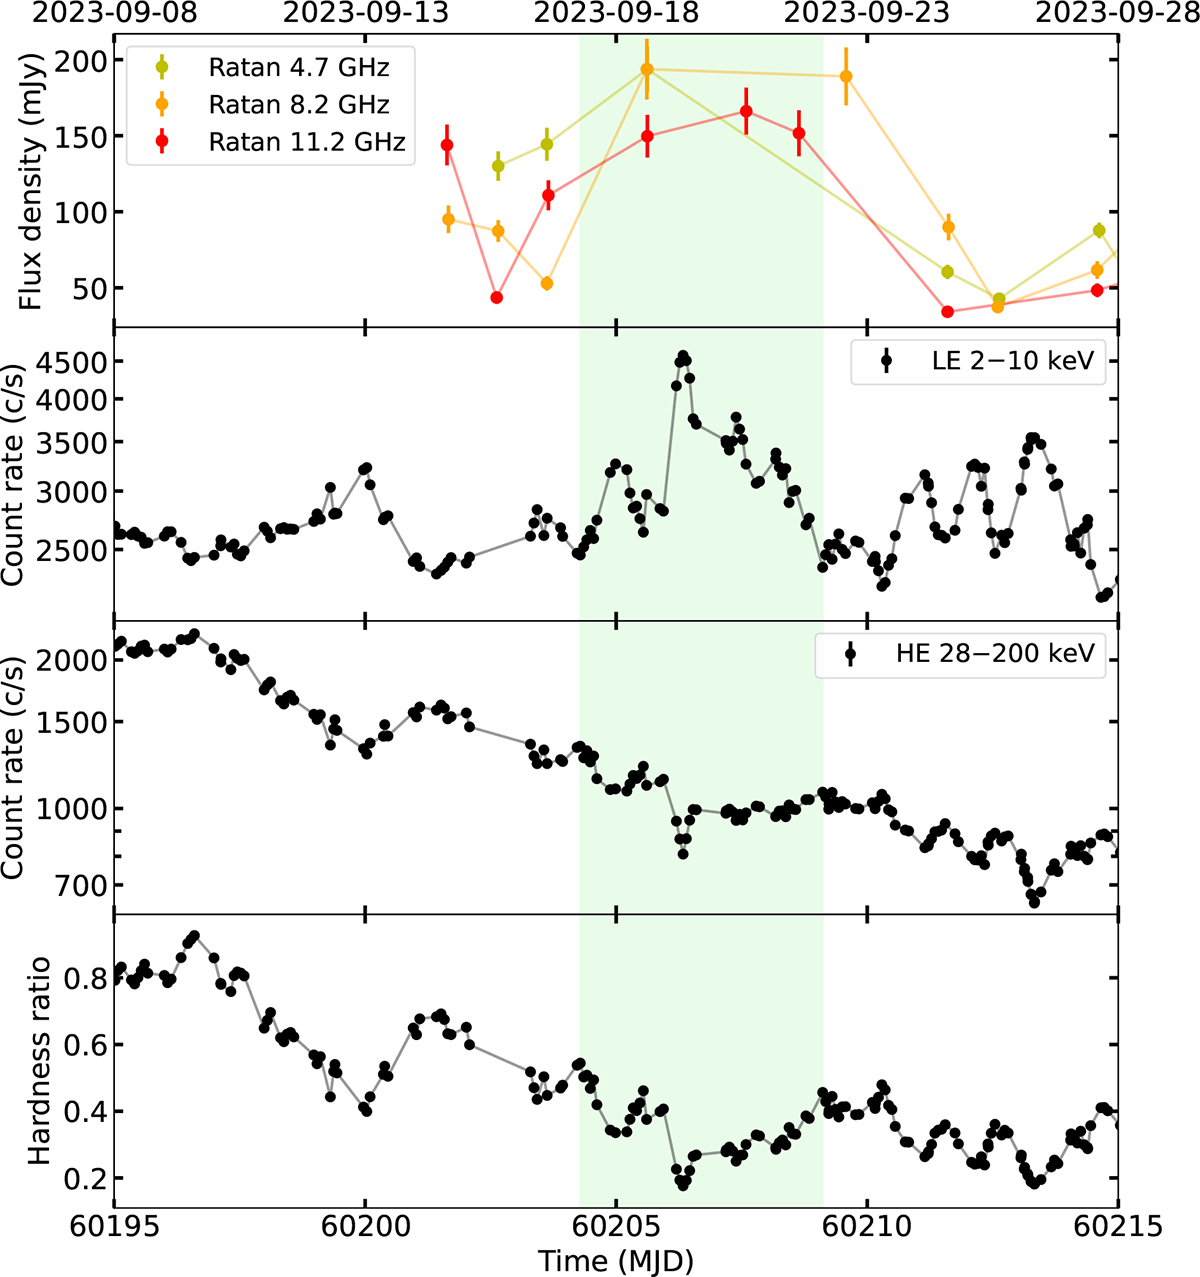
Fig. 1.
Download original image
Ratan radio and Insight-HXMT X-ray observations of Swift J1727.8−1613 in the period MJD 60195−60215. Each point corresponds to an individual GTI. From top to bottom, the panels show, respectively, the Ratan radio fluxes at three frequencies (Ingram et al. 2024), the LE 2 − 10 keV light curve, the HE 28 − 200 keV light curve, and the corresponding hardness ratio. The shaded green region indicates the observations we use in this paper.
Current usage metrics show cumulative count of Article Views (full-text article views including HTML views, PDF and ePub downloads, according to the available data) and Abstracts Views on Vision4Press platform.
Data correspond to usage on the plateform after 2015. The current usage metrics is available 48-96 hours after online publication and is updated daily on week days.
Initial download of the metrics may take a while.