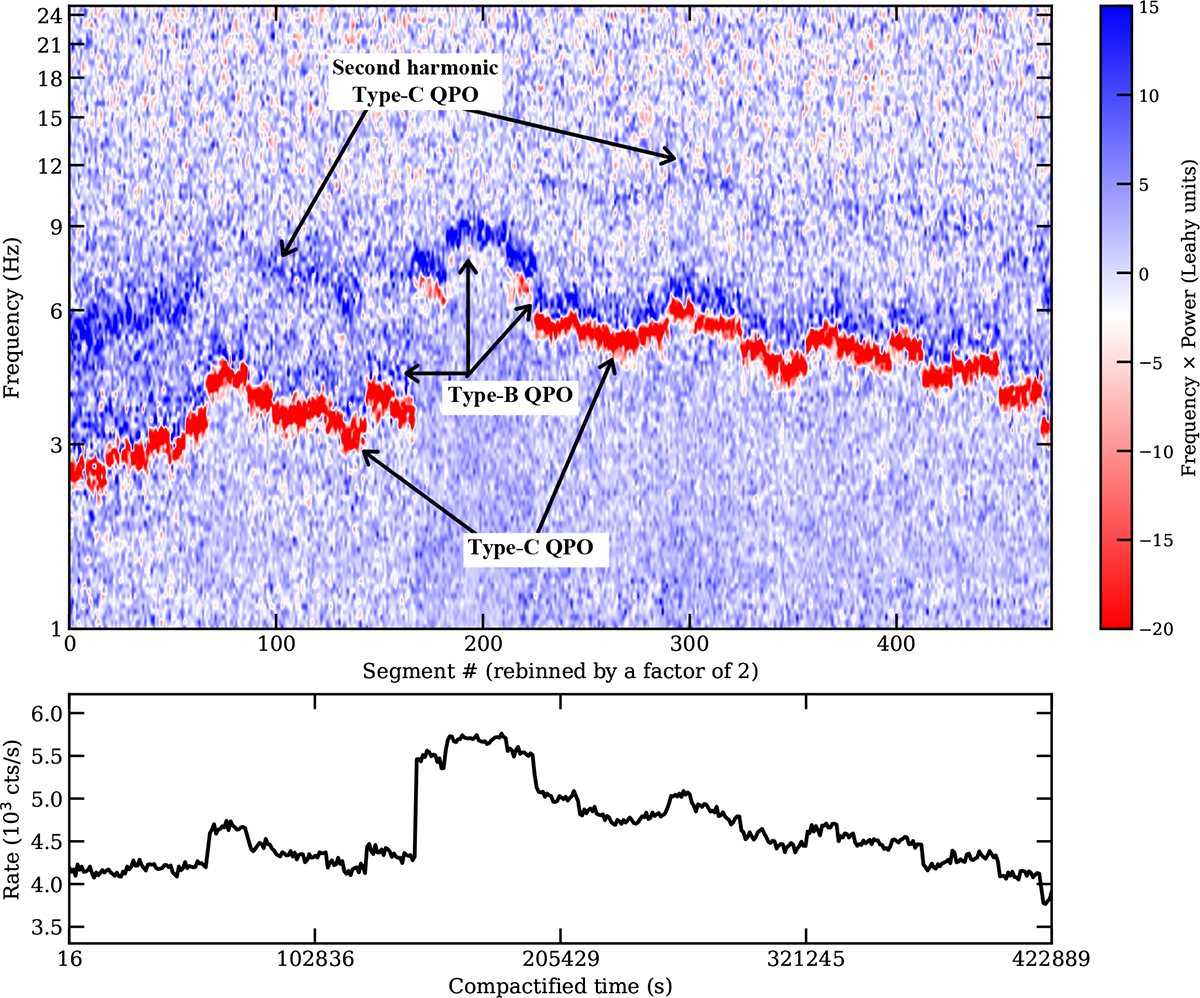
Fig. 10.
Download original image
Dynamical imaginary cross-spectrum of Swift J1727.8−1613 between MJD 60204 and 60209. The photon count rate of the light curve in the bottom panel is the sum of the LE (2 − 10 keV) and HE (28 − 200 keV) count rates. The dynamical imaginary cross-spectrum is given in Leahy units (Leahy et al. 1983); the segments in the X axis have a duration of ∼60 seconds. We do not show the time gaps between observations to produce a more compact plot; the time gaps can be seen in Fig. 2. Compactified time is the true elapsed time in seconds since MJD 60204.22117, with the gaps in the data removed from the plot. The arrows identify the Type-B QPO, and the Type-C QPO and its second harmonic.
Current usage metrics show cumulative count of Article Views (full-text article views including HTML views, PDF and ePub downloads, according to the available data) and Abstracts Views on Vision4Press platform.
Data correspond to usage on the plateform after 2015. The current usage metrics is available 48-96 hours after online publication and is updated daily on week days.
Initial download of the metrics may take a while.