Fig. B.1.
Download original image
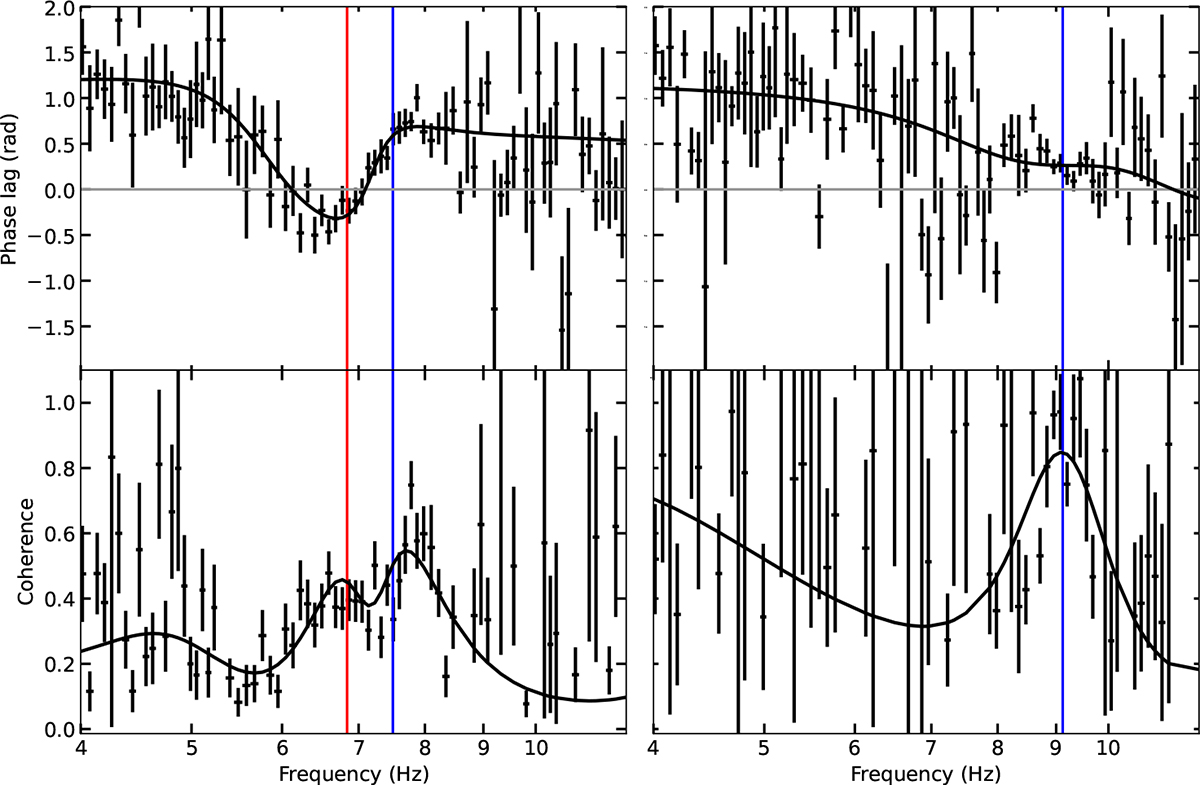
Phase lags and the coherence function of Obs #5 (left panel) and #4 (right panel) in Table 1. The red vertical line indicates the centroid frequency of the Type-C QPO, while the blue vertical line indicates that of the Type-B QPO. The models are not fitted to the data, but predicted on the basis of the parameters of the Lorentzians fitted to the PDS and the real and imaginary parts of the CS.
Current usage metrics show cumulative count of Article Views (full-text article views including HTML views, PDF and ePub downloads, according to the available data) and Abstracts Views on Vision4Press platform.
Data correspond to usage on the plateform after 2015. The current usage metrics is available 48-96 hours after online publication and is updated daily on week days.
Initial download of the metrics may take a while.