Fig. 2.
Download original image
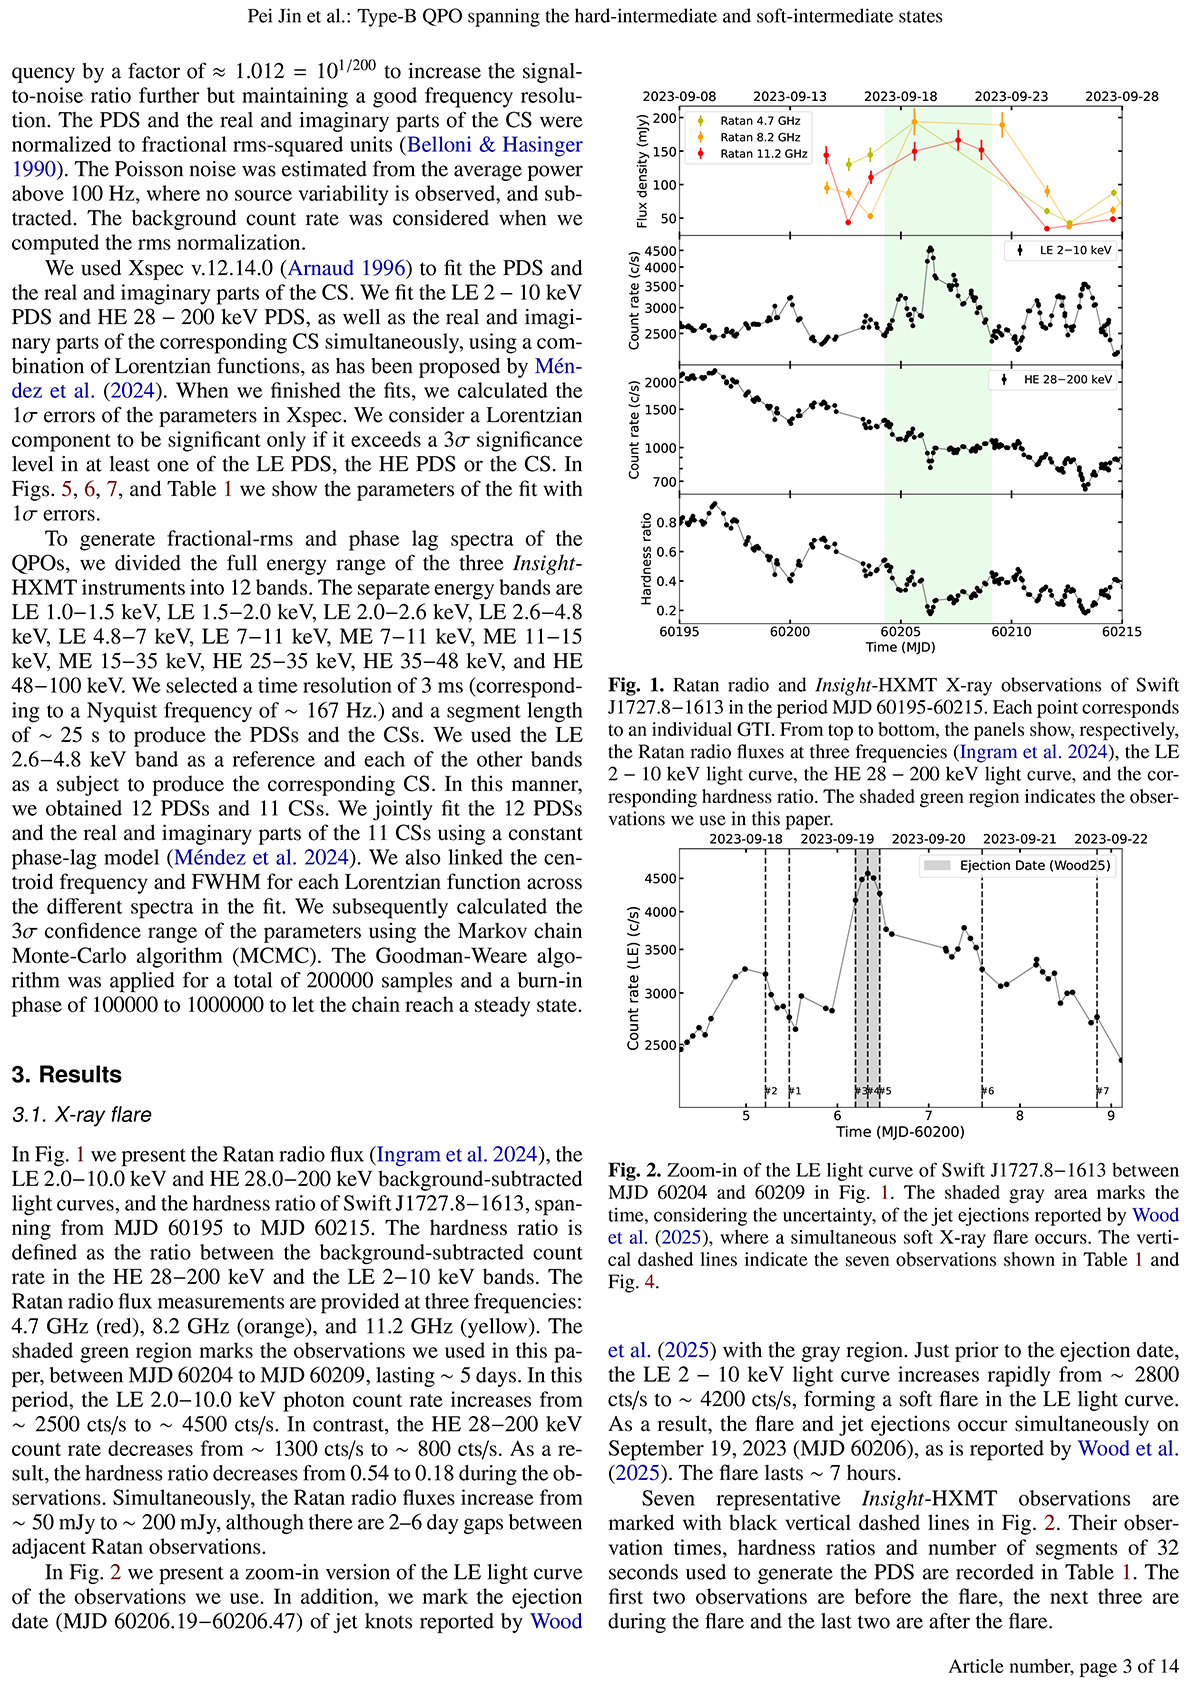
Zoom-in of the LE light curve of Swift J1727.8−1613 between MJD 60204 and 60209 in Fig. 1. The shaded gray area marks the time, considering the uncertainty, of the jet ejections reported by Wood et al. (2025), where a simultaneous soft X-ray flare occurs. The vertical dashed lines indicate the seven observations shown in Table 1 and Fig. 4.
Current usage metrics show cumulative count of Article Views (full-text article views including HTML views, PDF and ePub downloads, according to the available data) and Abstracts Views on Vision4Press platform.
Data correspond to usage on the plateform after 2015. The current usage metrics is available 48-96 hours after online publication and is updated daily on week days.
Initial download of the metrics may take a while.