Fig. 4.
Download original image
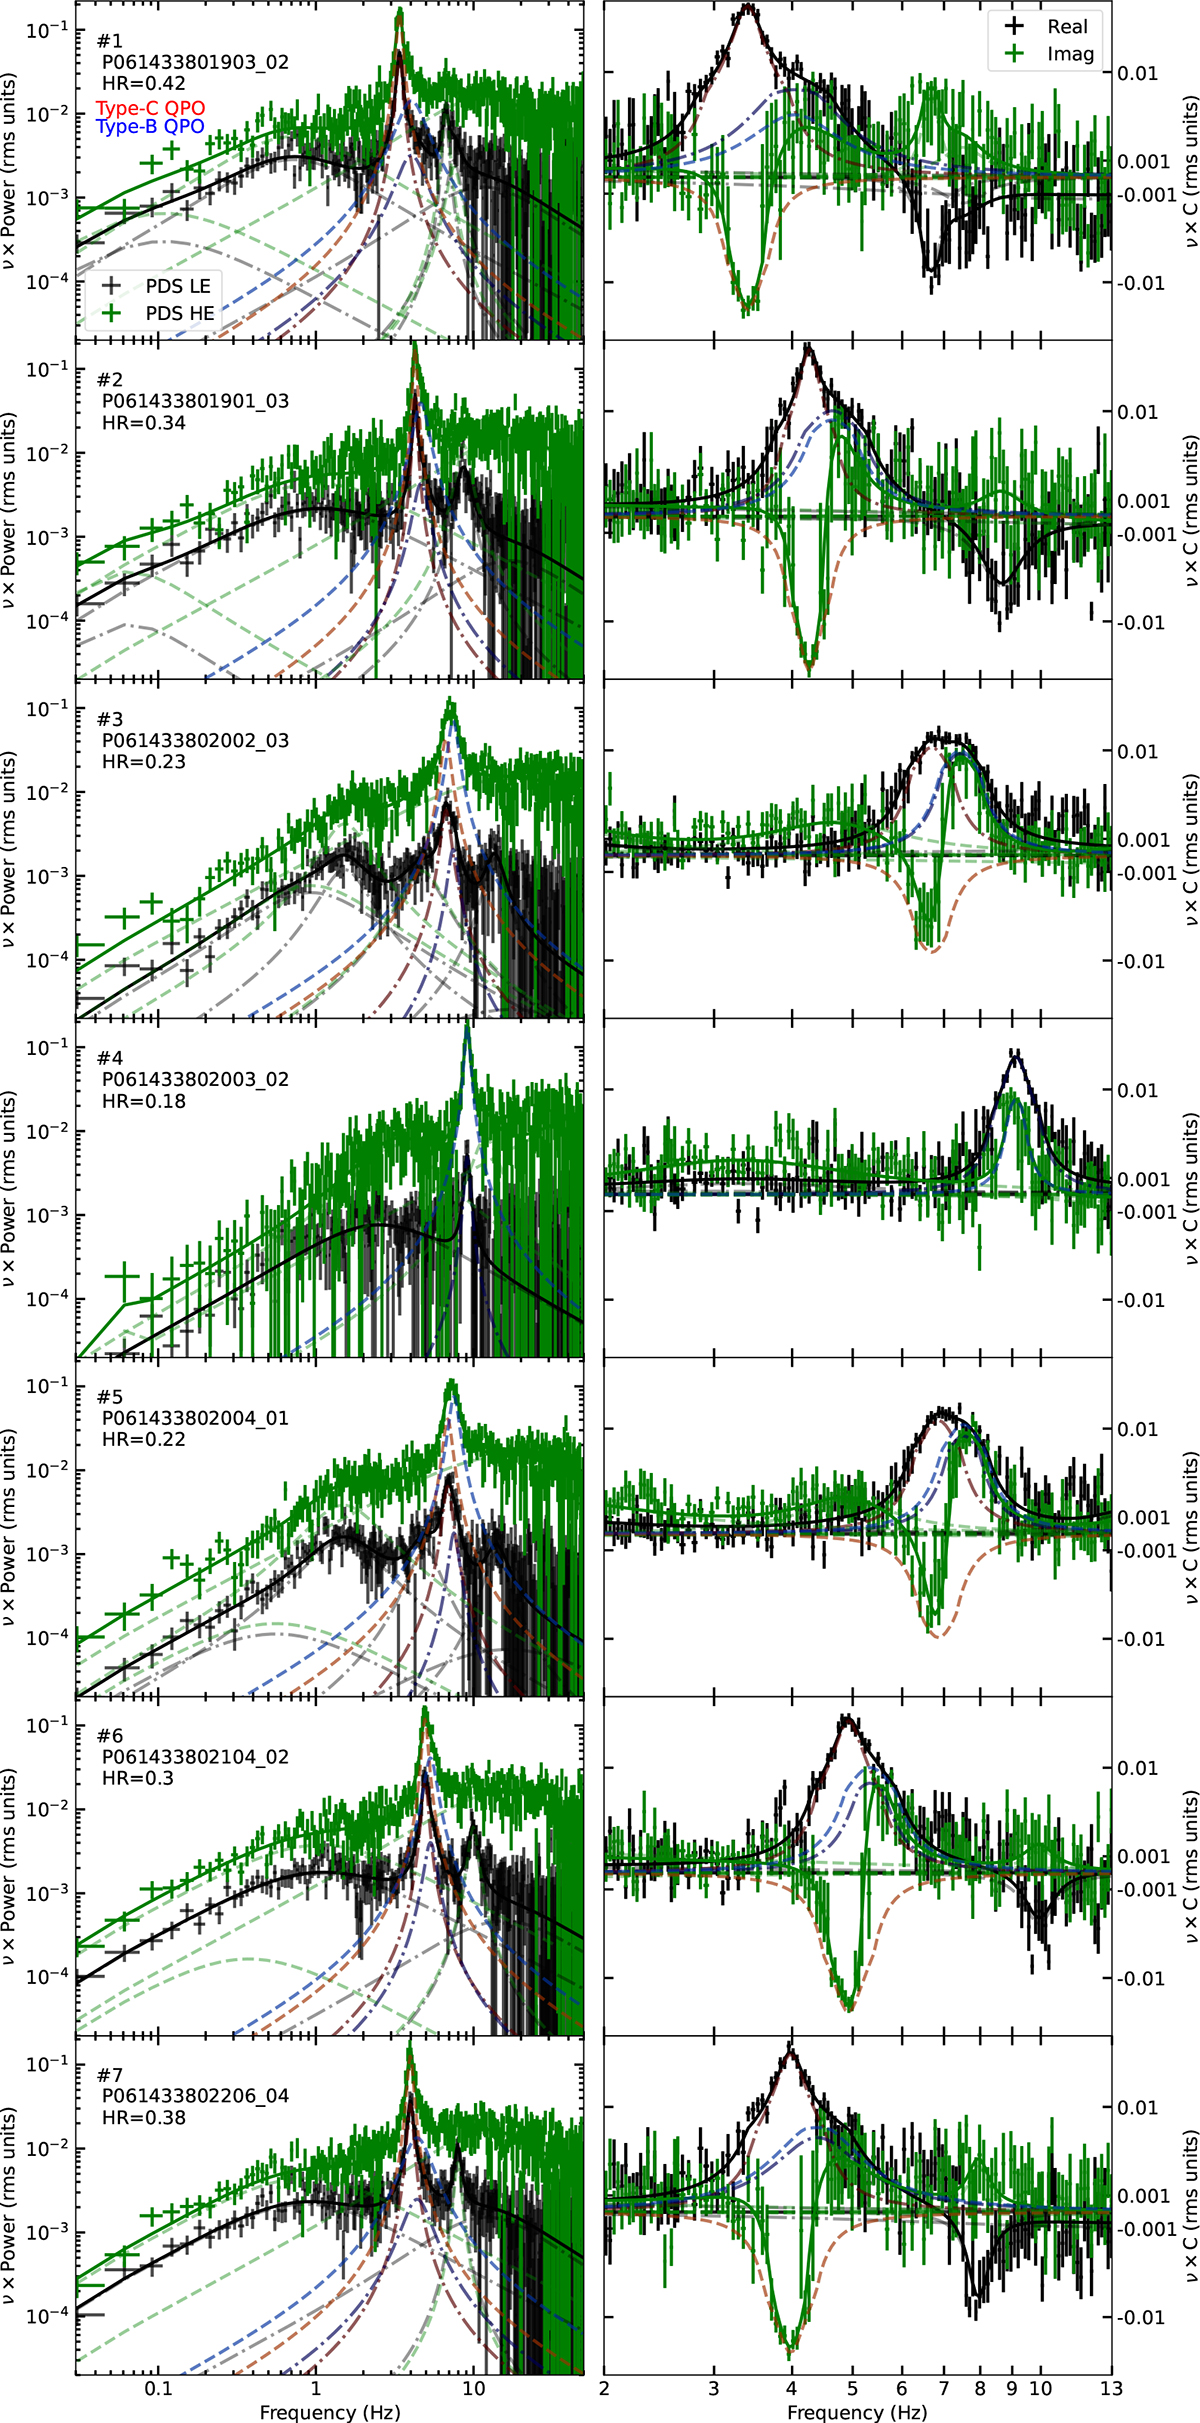
PDSs and CSs of the seven representative Insight-HXMT observations marked with vertical lines in Fig. 2, and given in Table 1. Left panels: LE 2 − 10 keV PDS (black) and HE 28 − 200 keV PDS (green). Right panels: Real (black) and imaginary (green) parts of the CS. The individual Lorentzians are shown as dash-dotted lines in the LE PDS and dashed lines in the HE PDS; in the CS, the dash-dotted lines indicate the real part, and the dashed lines indicate the imaginary part. We highlight the Type-C (red) and Type-B (blue) QPOs in the PDSs and the CSs. Data with absolute values greater than or equal to 5 × 10⁻³ are scaled logarithmically, while values with absolute values smaller than 5 × 10⁻³ are scaled linearly.
Current usage metrics show cumulative count of Article Views (full-text article views including HTML views, PDF and ePub downloads, according to the available data) and Abstracts Views on Vision4Press platform.
Data correspond to usage on the plateform after 2015. The current usage metrics is available 48-96 hours after online publication and is updated daily on week days.
Initial download of the metrics may take a while.