Open Access
Fig. 5.
Download original image
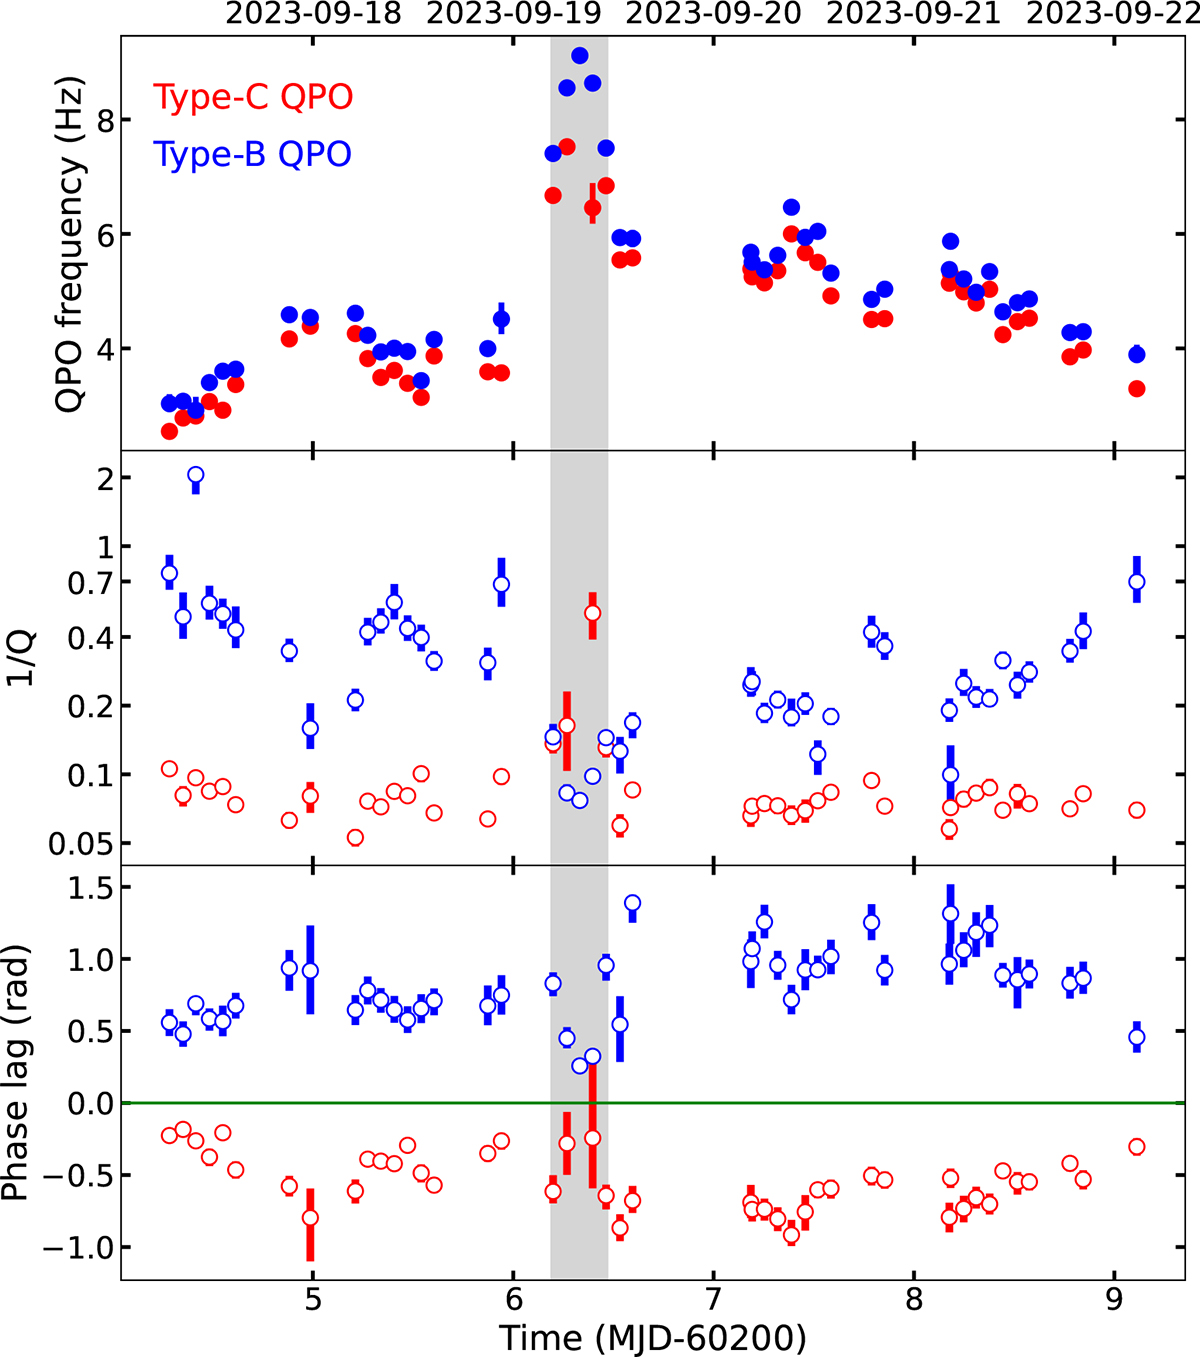
Parameters of the Type-C and Type-B QPOs of the observations of Swift J1727.8−1613 in Fig. 2. Top panel: QPO frequency. Middle panel: 1/Q. Bottom panel: Phase lag. The gray area marks the time of the soft X-ray flare and the jet ejections reported by Wood et al. (2025).
Current usage metrics show cumulative count of Article Views (full-text article views including HTML views, PDF and ePub downloads, according to the available data) and Abstracts Views on Vision4Press platform.
Data correspond to usage on the plateform after 2015. The current usage metrics is available 48-96 hours after online publication and is updated daily on week days.
Initial download of the metrics may take a while.