Fig. 9.
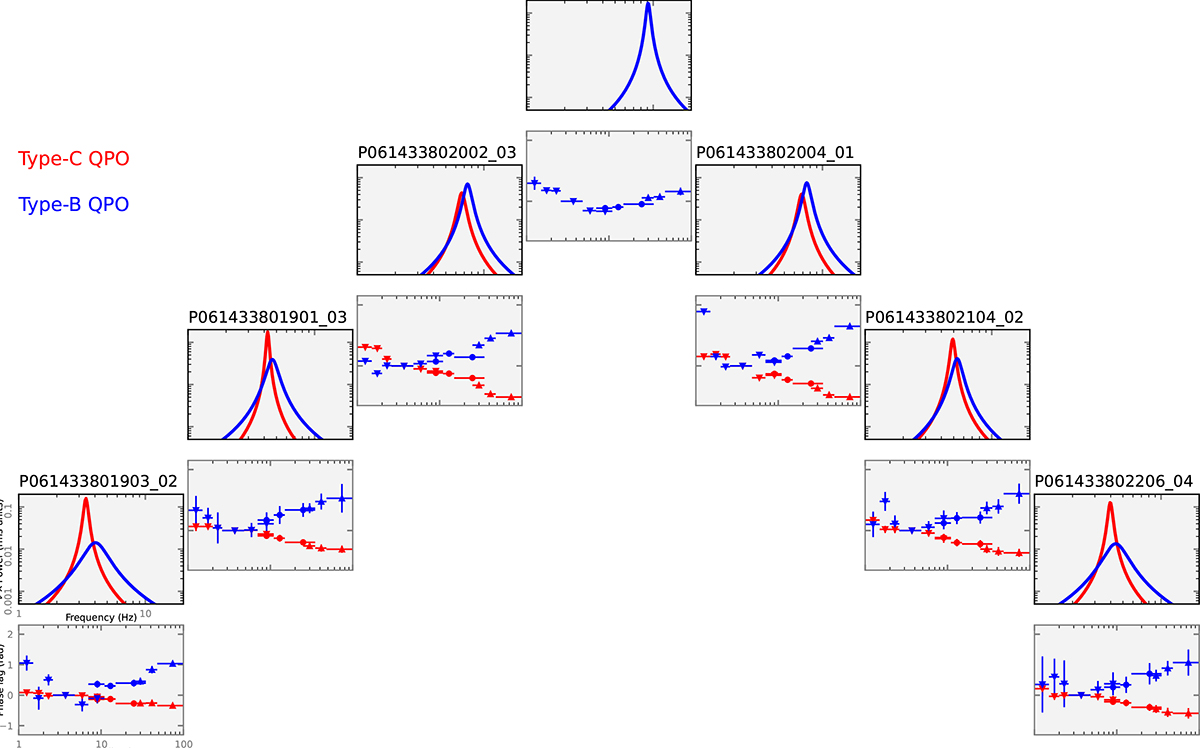
Download original image
Evolution of the Type-C (red) and Type-B (blue) QPOs in the HE PDS and corresponding phase-lag spectra across seven observations in Table 1 and Fig. 4, ordered by observation sequence number along the horizontal axis. The x and y ranges are the same across all panels. The vertical axes represent increasing 2 − 10 keV intensity (upward) and decreasing spectral hardness (downward). The profiles of the Type-C and Type-B QPOs are extracted from Fig. 4, with all other data and Lorentzian components omitted for clarity. The phase lag spectra shown are identical to those presented in Fig. 8. The first two observations occur before the soft X ray flare on MJD 60206, the next three during the flare, and the final two after the flare.
Current usage metrics show cumulative count of Article Views (full-text article views including HTML views, PDF and ePub downloads, according to the available data) and Abstracts Views on Vision4Press platform.
Data correspond to usage on the plateform after 2015. The current usage metrics is available 48-96 hours after online publication and is updated daily on week days.
Initial download of the metrics may take a while.