Fig. 2.
Download original image
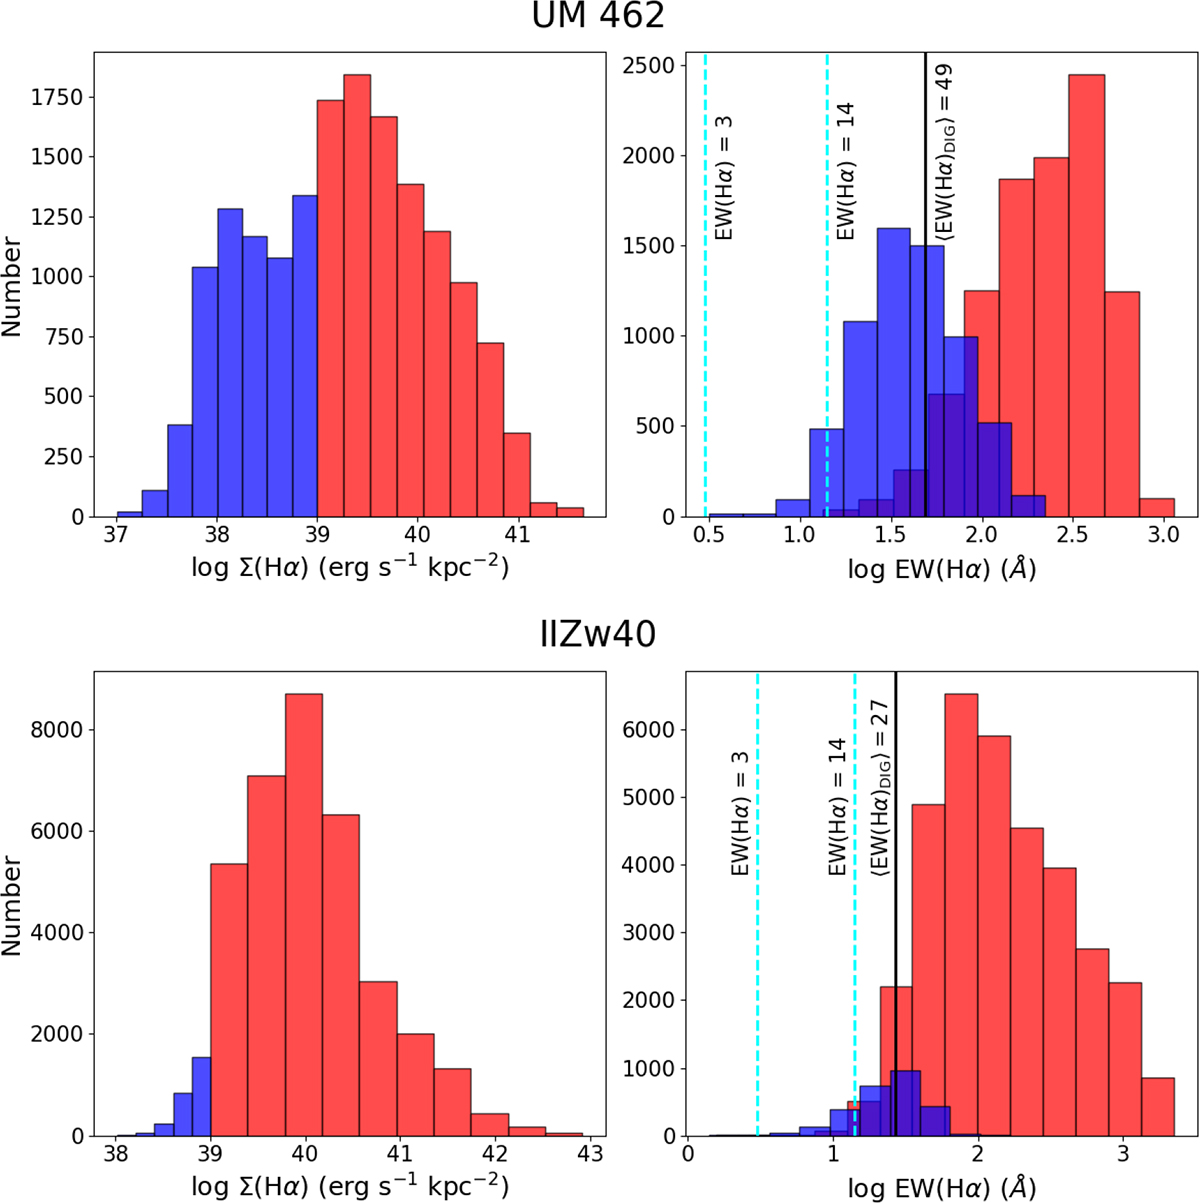
Histograms of Σ(Hα) and EW(Hα). The HII-dominated spaxel values are shown in red, while DIG-dominated spaxel values are in blue. The dotted cyan lines indicate the classification by Lacerda et al. (2018), where DIG-dominated regions have EW(Hα) < 3 Å and HII region-dominated areas have EW(Hα) > 14 Å. The mean spaxel values of our DIG-dominated areas are indicated by the vertical black lines.
Current usage metrics show cumulative count of Article Views (full-text article views including HTML views, PDF and ePub downloads, according to the available data) and Abstracts Views on Vision4Press platform.
Data correspond to usage on the plateform after 2015. The current usage metrics is available 48-96 hours after online publication and is updated daily on week days.
Initial download of the metrics may take a while.