Fig. 4.
Download original image
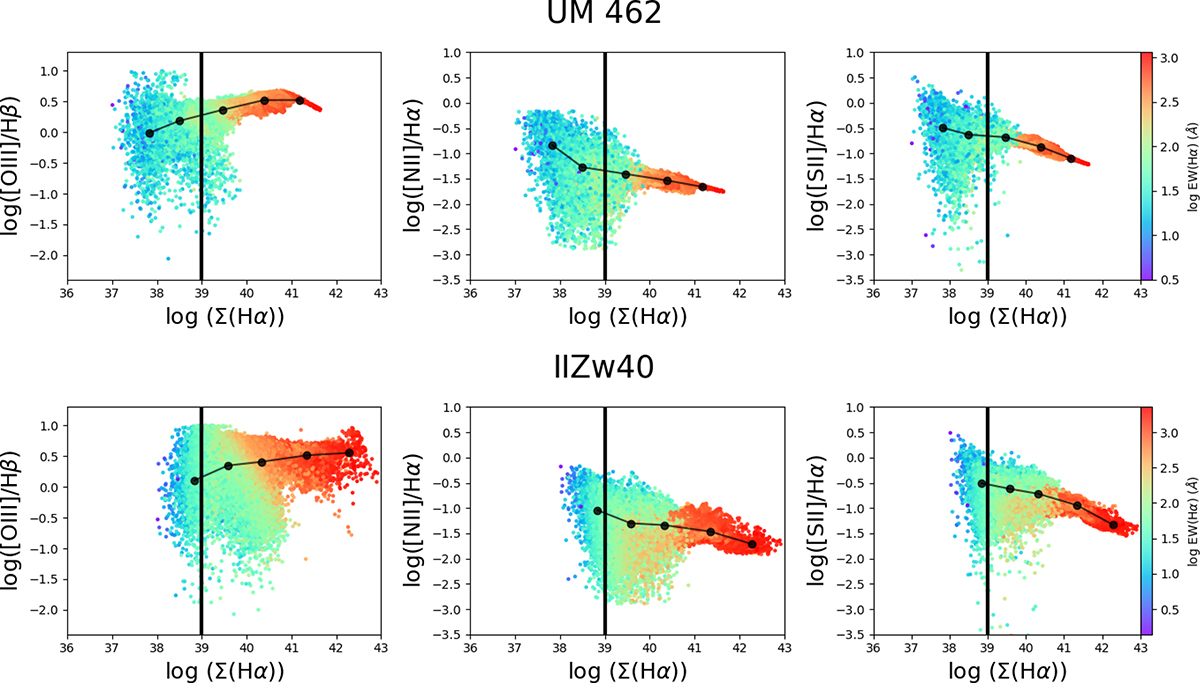
Emission line ratios log([OIII] λ5007/Hβ), log([SII] λλ6717,6731/Hα), and log([NII] λ6584/Hα) versus log(Σ(Hα)). The vertical line indicates the threshold distinguishing DIG-dominated regions, defined as areas with Σ(Hα) < 1039 erg s−1 kpc−2. The black data points correspond to the mean values within the different Σ(Hα) bins defined in Sect. 3.2. There is a clear increasing pattern of [SII]/Hα and [NII]/Hα ratios and a decreasing trend of [OIII]/Hβ as Σ(Hα) decreases. The colour scale at the right of each panel indicates the EW(Hα).
Current usage metrics show cumulative count of Article Views (full-text article views including HTML views, PDF and ePub downloads, according to the available data) and Abstracts Views on Vision4Press platform.
Data correspond to usage on the plateform after 2015. The current usage metrics is available 48-96 hours after online publication and is updated daily on week days.
Initial download of the metrics may take a while.