Fig. 5.
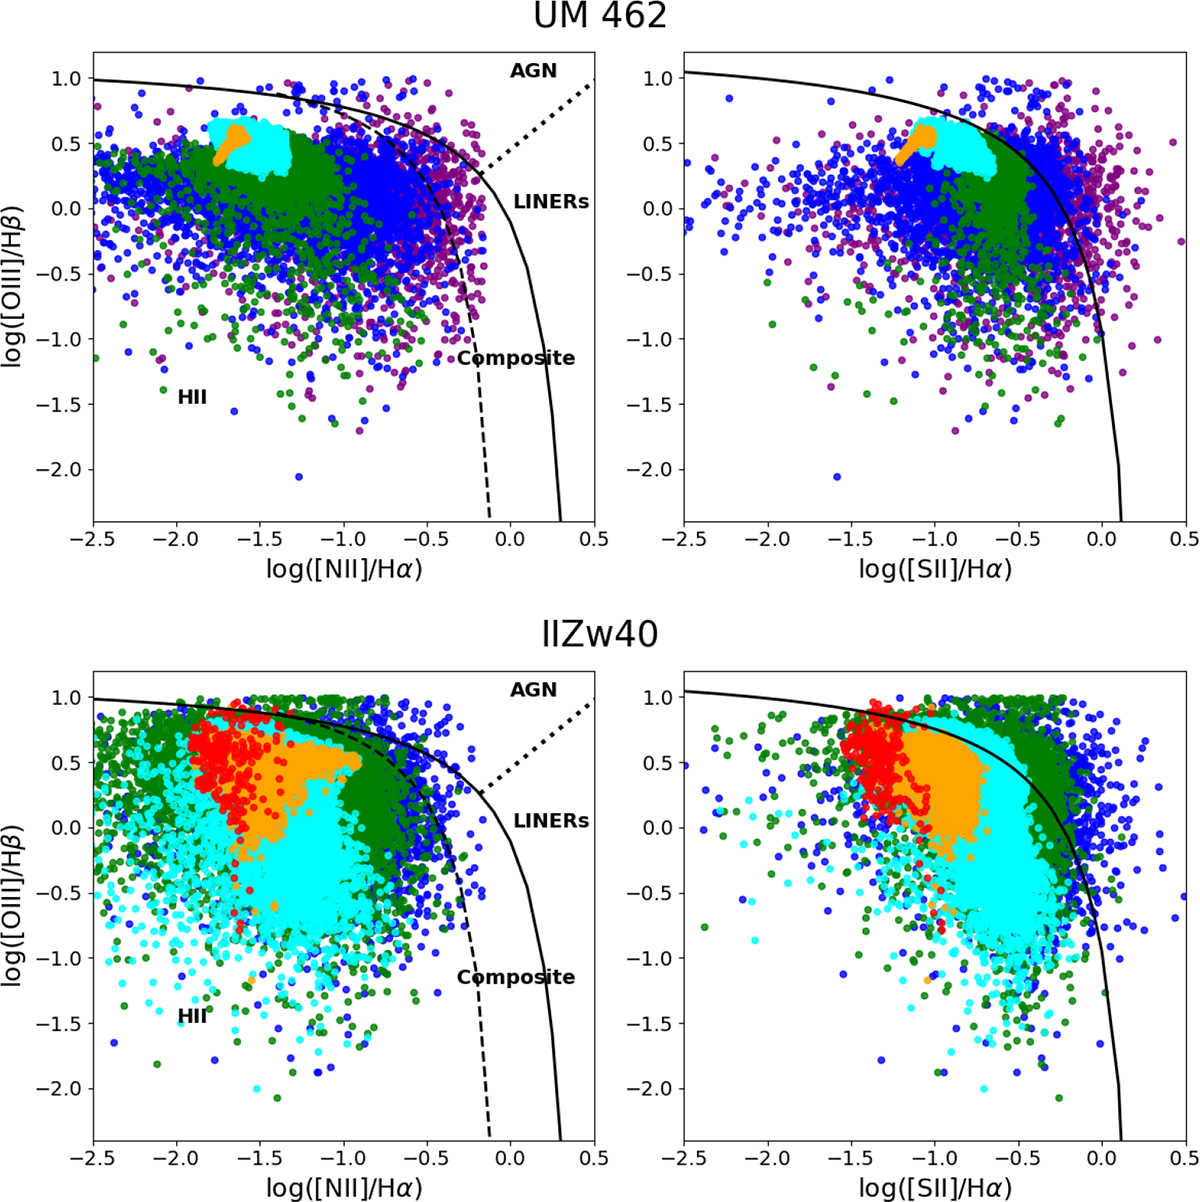
Download original image
BPT diagrams log([OIII]/Hβ versus log([NII]/Hα) and log([OIII]/Hβ) versus log([SII]/Hα for UM 462 (upper panels) and IIZw40 (lower panels). The colour code represents the spaxels of the galaxies divided into the different log(Σ(Hα)) bins of < 38–37 (purple), < 39–38 (blue), < 40–39 (green), < 41–40 (cyan), < 42–41 (orange), and < 43–42 (red) in units of log erg s−1 kpc−2. In the BPT diagrams, we include the Kewley et al. (2001) (solid lines), Kauffmann et al. (2003) (dashed lines), and Schawinski et al. (2007) (dotted lines) model boundary lines, which divide regions dominated by star-forming HII, composite, and AGN/LINERs.
Current usage metrics show cumulative count of Article Views (full-text article views including HTML views, PDF and ePub downloads, according to the available data) and Abstracts Views on Vision4Press platform.
Data correspond to usage on the plateform after 2015. The current usage metrics is available 48-96 hours after online publication and is updated daily on week days.
Initial download of the metrics may take a while.