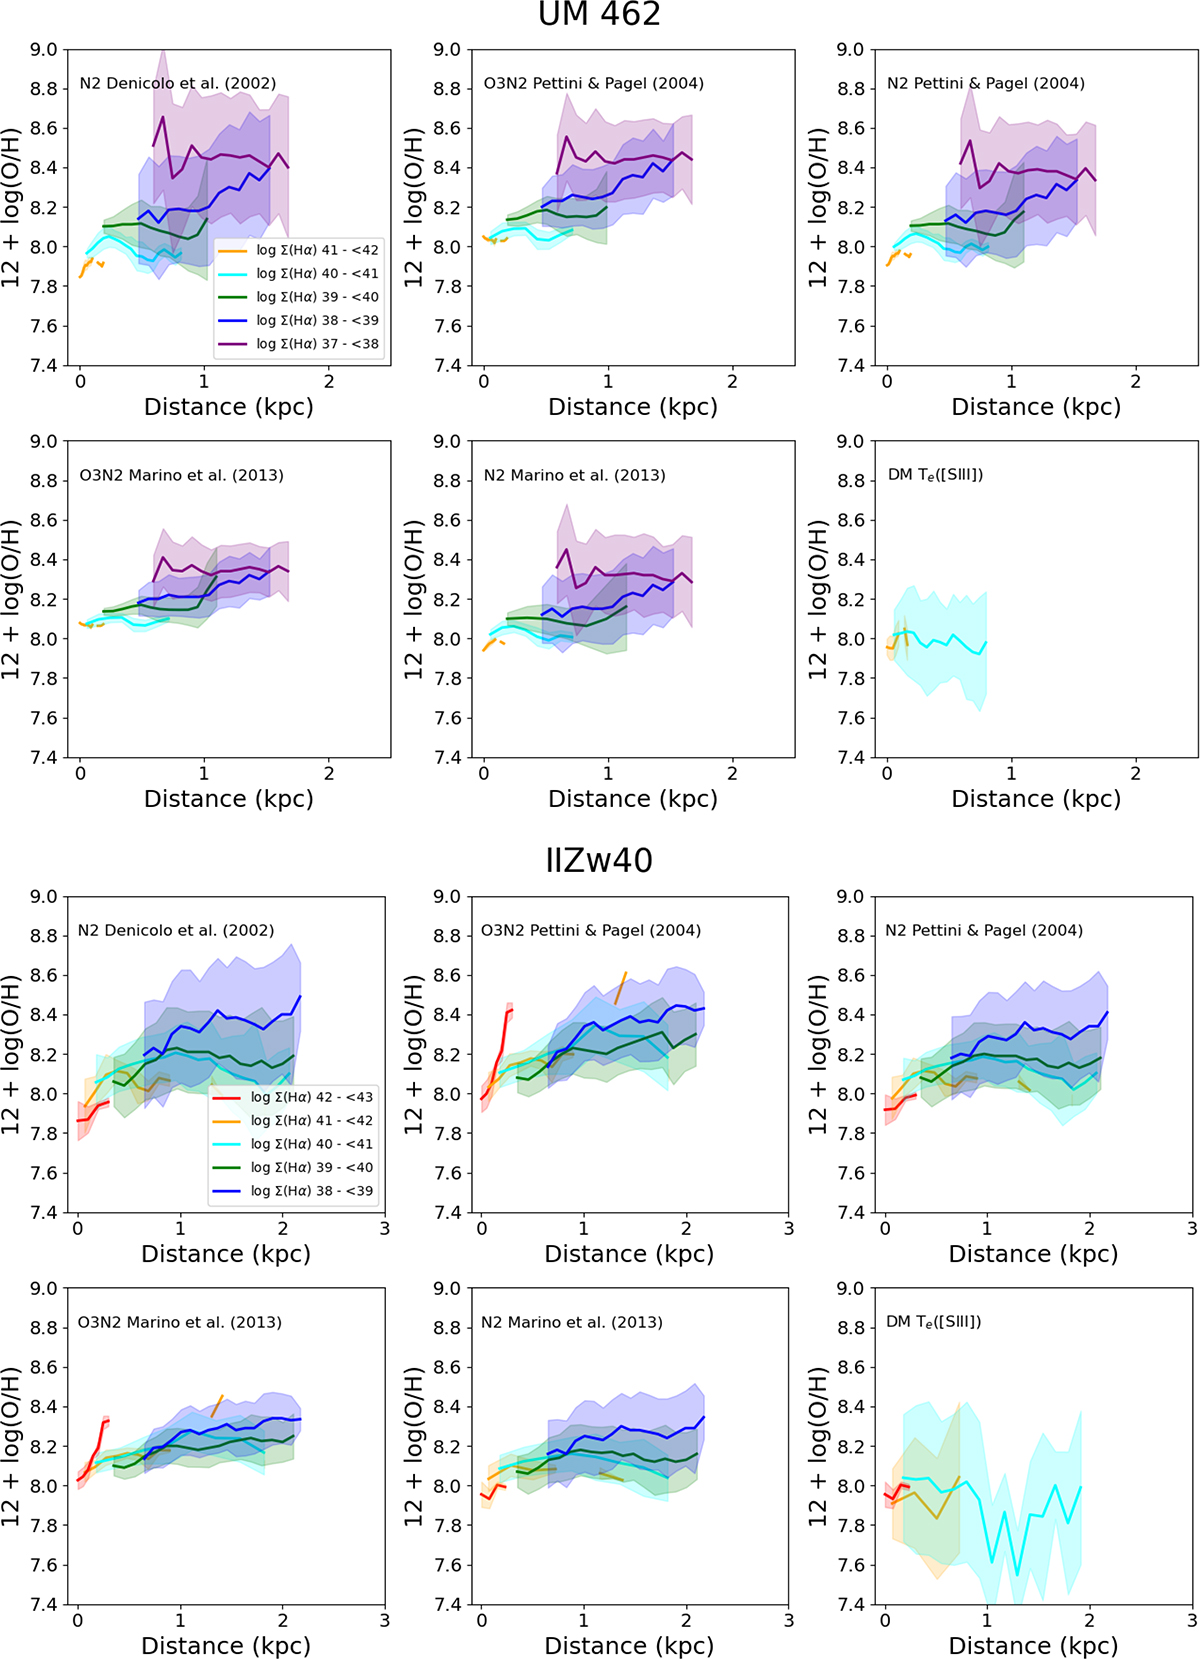
Fig. 7.
Download original image
Mean 12 + log(O/H) profiles for levels of Σ(Hα) for UM 462 (upper panels) and IIZw40 (lower panels). The standard deviation for the different 12 + log(O/H) values within each bin are indicated by the shaded regions. A clear increase in the mean metallicity values can be observed with decreasing Σ(Hα) when using both the N2 and O3N2 indices across all calibrators. A slight upwards trend in 12 + log(O/H) is also observed with the direct method in the HII-dominated regions. However, this difference is not statistically significant within the uncertainties.
Current usage metrics show cumulative count of Article Views (full-text article views including HTML views, PDF and ePub downloads, according to the available data) and Abstracts Views on Vision4Press platform.
Data correspond to usage on the plateform after 2015. The current usage metrics is available 48-96 hours after online publication and is updated daily on week days.
Initial download of the metrics may take a while.