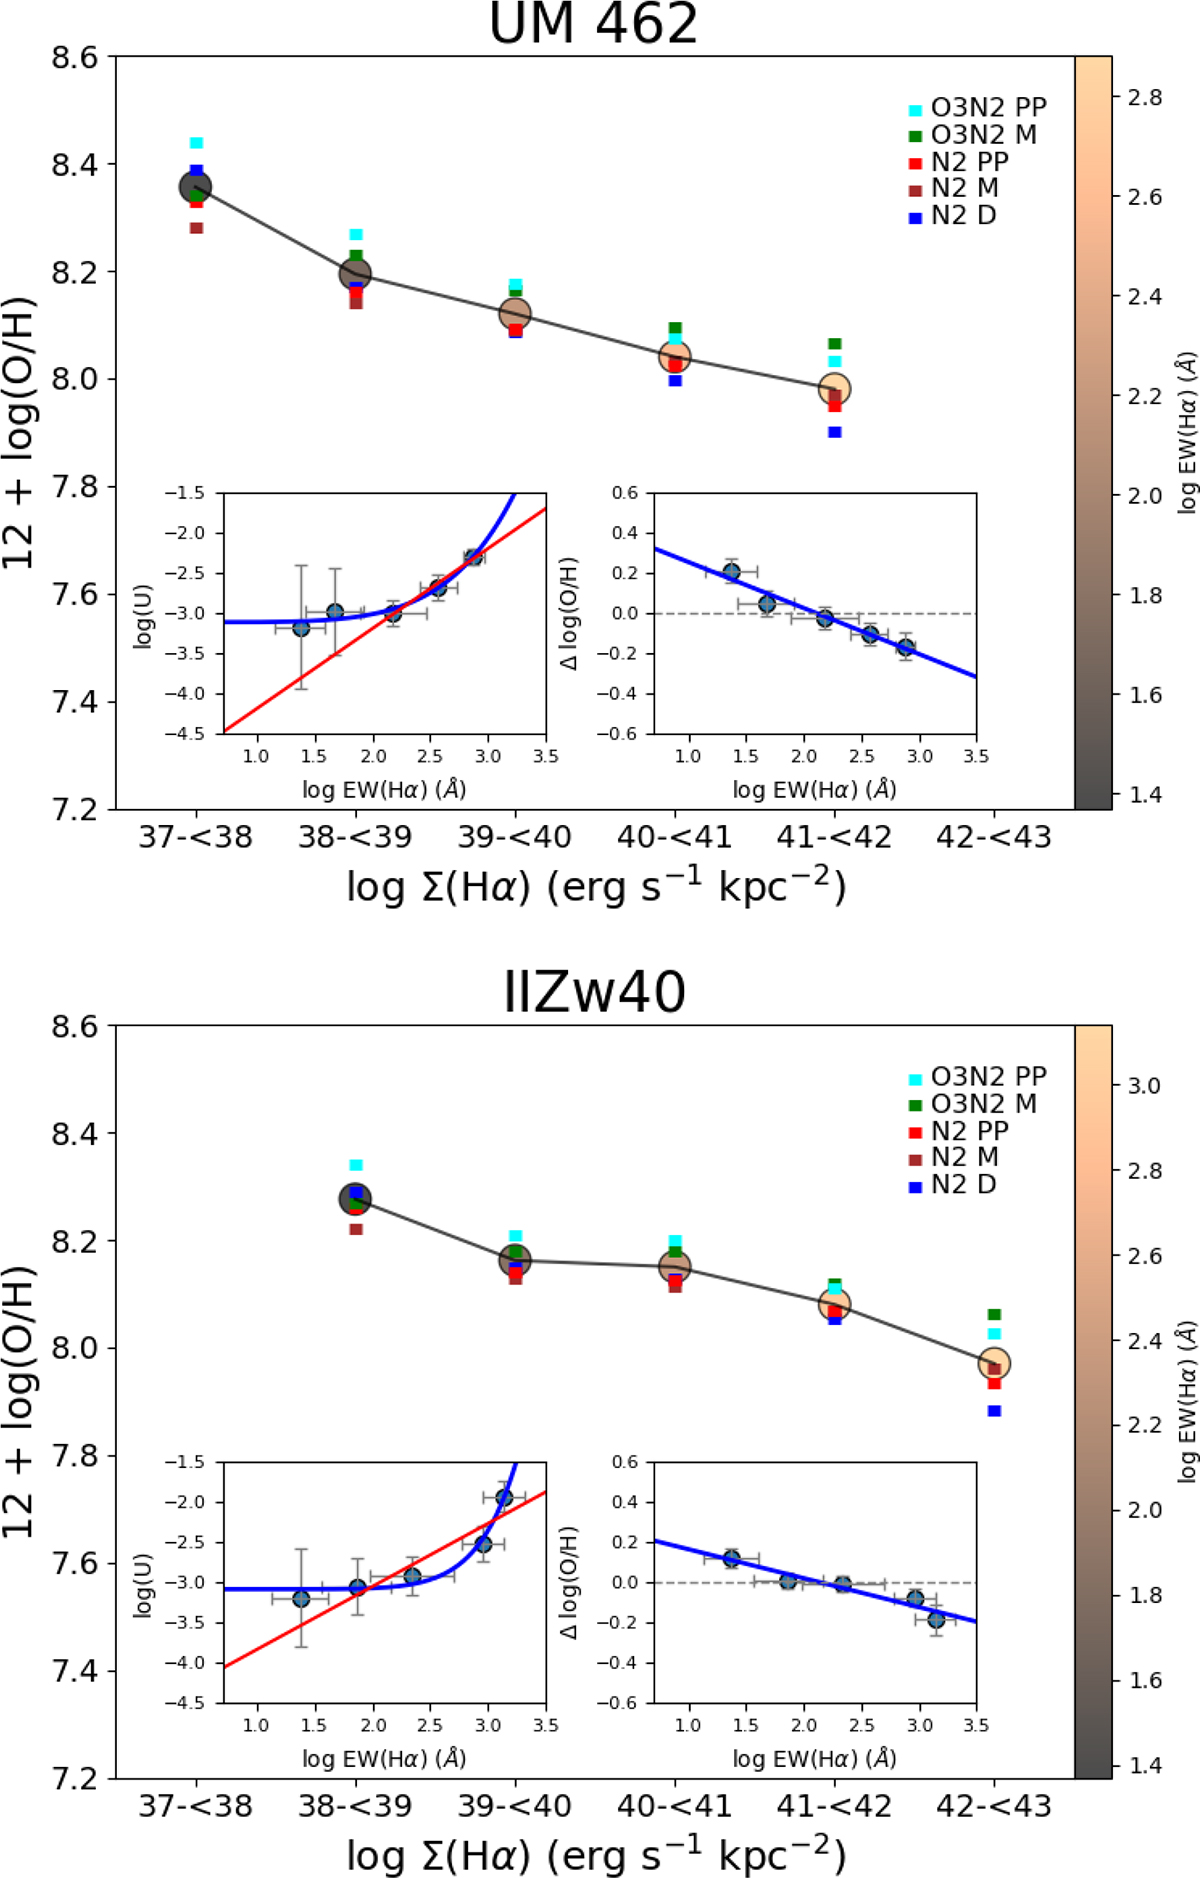
Fig. 8.
Download original image
Relationship between the mean 12 + log(O/H) and surface brightness bins for UM 462 and IIZw40. The values from the calibrators used in this study are indicated by the coloured squares in the figure. The inset panels show the log(U) (left panels) and the difference in O/H relative to the mean value of the galaxies (Δ(O/H); right panels) as functions of the EW(Hα). Oxygen abundances show an inverse correlation with Σ(Hα). The DIG-dominated regions exhibit the highest oxygen abundances together with the lowest ionisation parameters and EW(Hα) values. We found a linear correlation between Δ(O/H) and EW(Hα).
Current usage metrics show cumulative count of Article Views (full-text article views including HTML views, PDF and ePub downloads, according to the available data) and Abstracts Views on Vision4Press platform.
Data correspond to usage on the plateform after 2015. The current usage metrics is available 48-96 hours after online publication and is updated daily on week days.
Initial download of the metrics may take a while.