Fig. 9.
Download original image
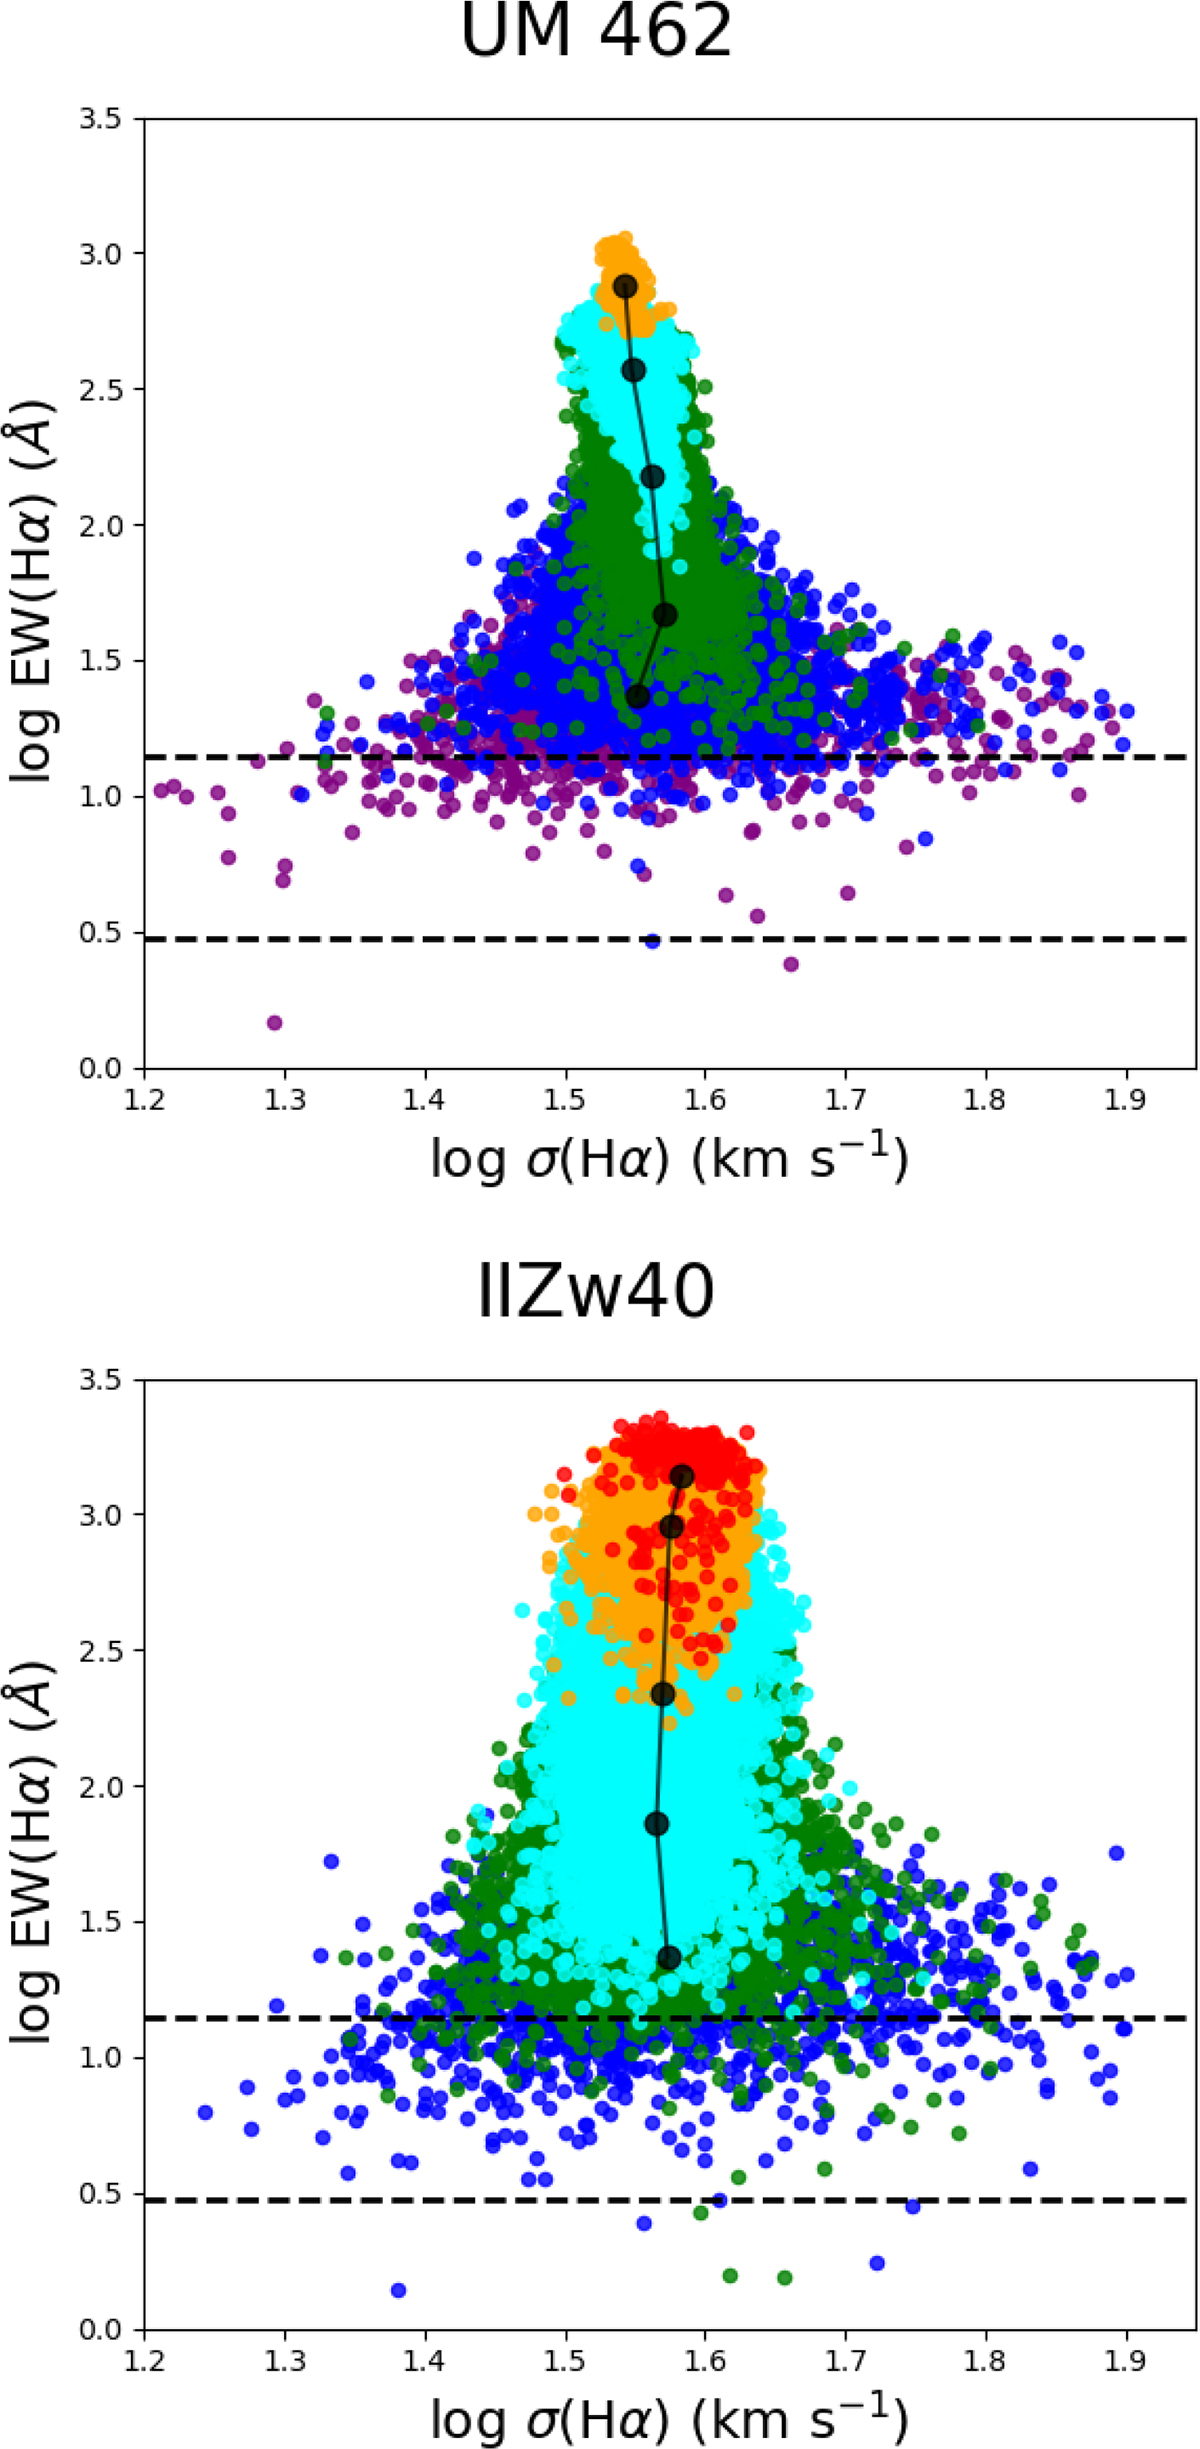
Resolved log(EW(Hβ)) versus log(σ(Hα)) for UM 462 (upper panel) and IIZw40 (lower panel). The colour code represents the regions of the galaxies divided into different Σ(Hα) bins of 37–< 38 (purple), 38–< 39 (blue), 39–< 40 (green), 40–< 41 (cyan), 41–< 42 (orange), and 42–< 43 (red) in units of log erg s−1 kpc−2. The dotted horizontal lines indicate the classification proposed by Lacerda et al. (2018), where HOLMES DIG-dominated regions have EW(Hα) < 3 Å (lower dashed line), and HII-dominated areas have EW(Hα) > 14 Å (upper dashed line). The black data points correspond to the mean values within the different Σ(Hα) bins. The central and vertical bands clearly correspond to the HII-dominated regions, whereas the more disturbed, extended bands are those associated with the DIG-dominated areas.
Current usage metrics show cumulative count of Article Views (full-text article views including HTML views, PDF and ePub downloads, according to the available data) and Abstracts Views on Vision4Press platform.
Data correspond to usage on the plateform after 2015. The current usage metrics is available 48-96 hours after online publication and is updated daily on week days.
Initial download of the metrics may take a while.