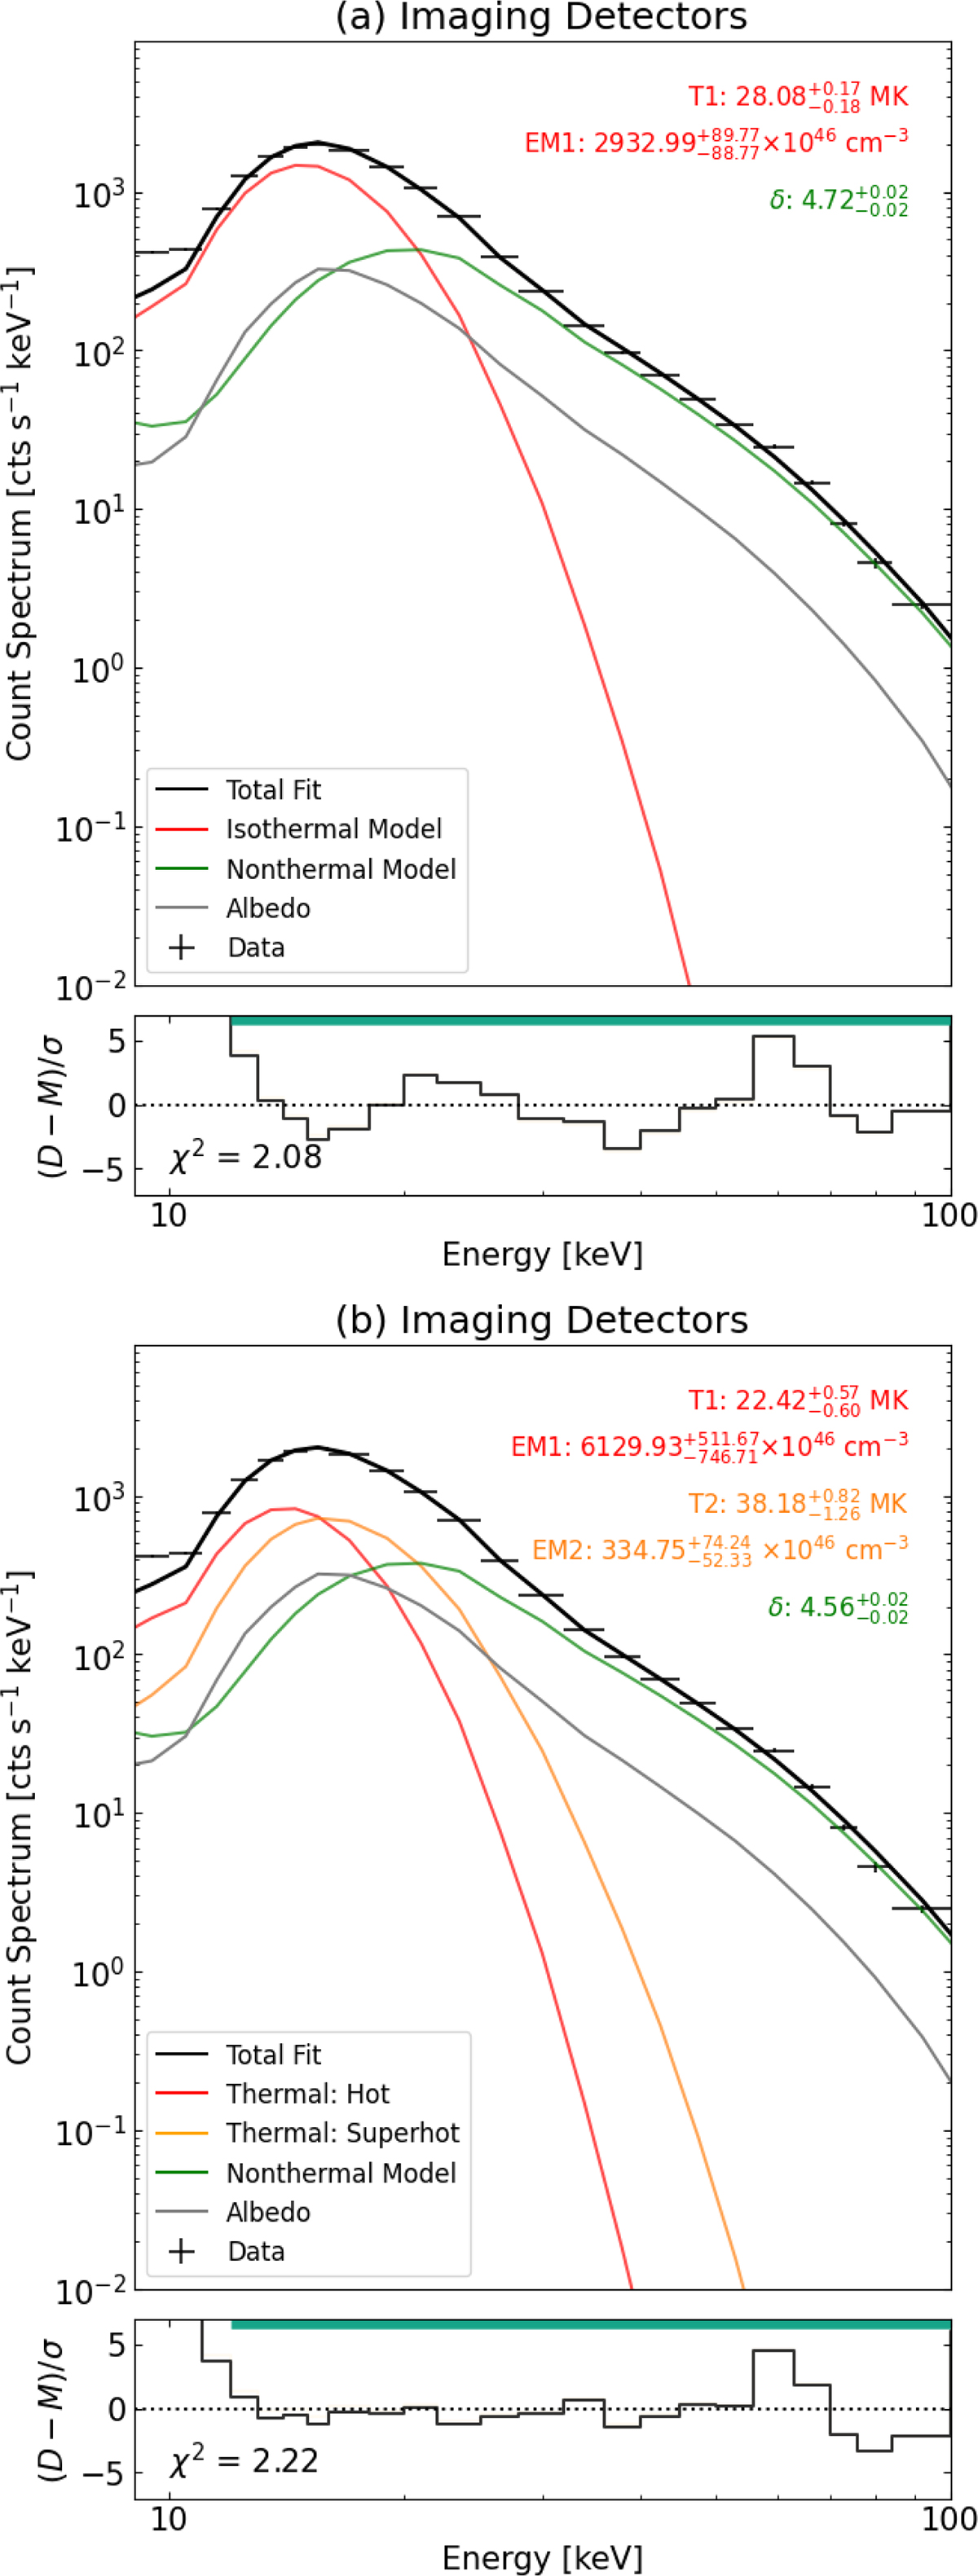
Fig. 1.
Download original image
Spectrum of the estimate X5-class flare SOL20230103 recorded by the imaging detectors of STIX. The spectrum is integrated over a time range of 10 s between 06:26:50–06:27:00 UTC (Earth time). The measured spectrum is the same in both panels, only the fitting model is different: for the top panel, a photon model including an isothermal model (red), a nonthermal model (green), and an albedo component (gray) is fit. The total fit is given in black. In the bottom panel, we used the same components for the photon model together with a second thermal component (orange). Below each spectrum, the residuals (data minus model divided by the uncertainty on the data points) and the χ2 are given. The green bar indicates the energy range used for fitting.
Current usage metrics show cumulative count of Article Views (full-text article views including HTML views, PDF and ePub downloads, according to the available data) and Abstracts Views on Vision4Press platform.
Data correspond to usage on the plateform after 2015. The current usage metrics is available 48-96 hours after online publication and is updated daily on week days.
Initial download of the metrics may take a while.