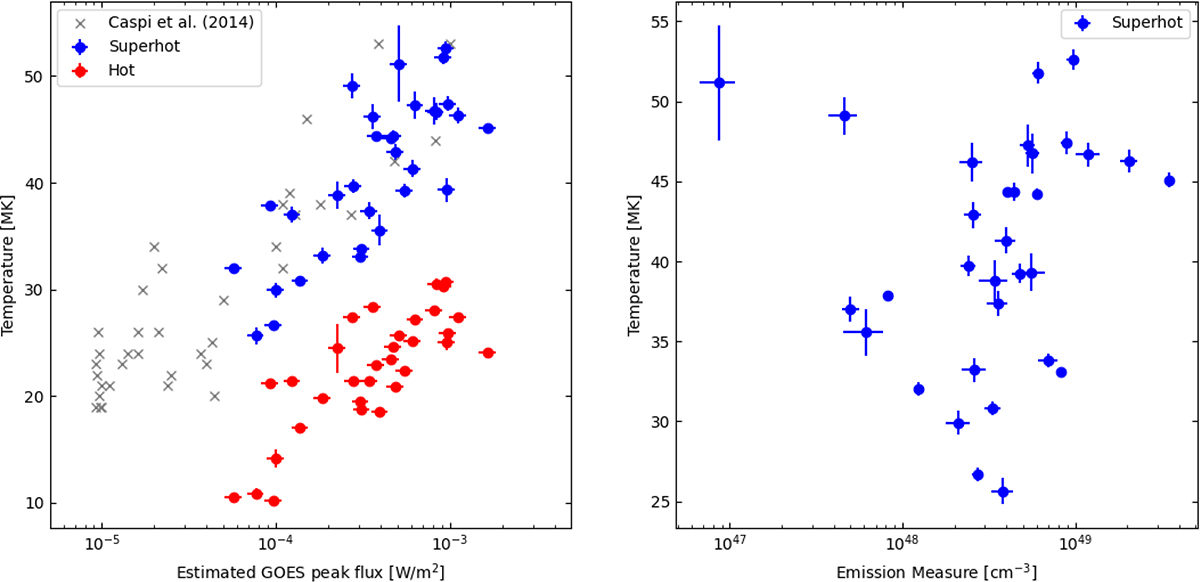
Fig. 3.
Download original image
Results of the statistical analysis using 32 STIX flares. In the left plot, the temperature of the thermal emission as a function of the GOES flare class is shown. The x axis is the GOES peak flux estimated on the low-energy counts from STIX, and the y axis gives the temperature of the thermal emission in megakelvin (MK). The blue and red dots represent the spectral fitting results for the superhot and the hot thermal component from 32 large STIX flares observed over the past three years (2022–2024). The gray crosses are the results from the statistical analysis in Caspi et al. (2014a) with RHESSI data. The right plot shows the temperature as a function of the EM of the superhot component.
Current usage metrics show cumulative count of Article Views (full-text article views including HTML views, PDF and ePub downloads, according to the available data) and Abstracts Views on Vision4Press platform.
Data correspond to usage on the plateform after 2015. The current usage metrics is available 48-96 hours after online publication and is updated daily on week days.
Initial download of the metrics may take a while.