Fig. 4.
Download original image
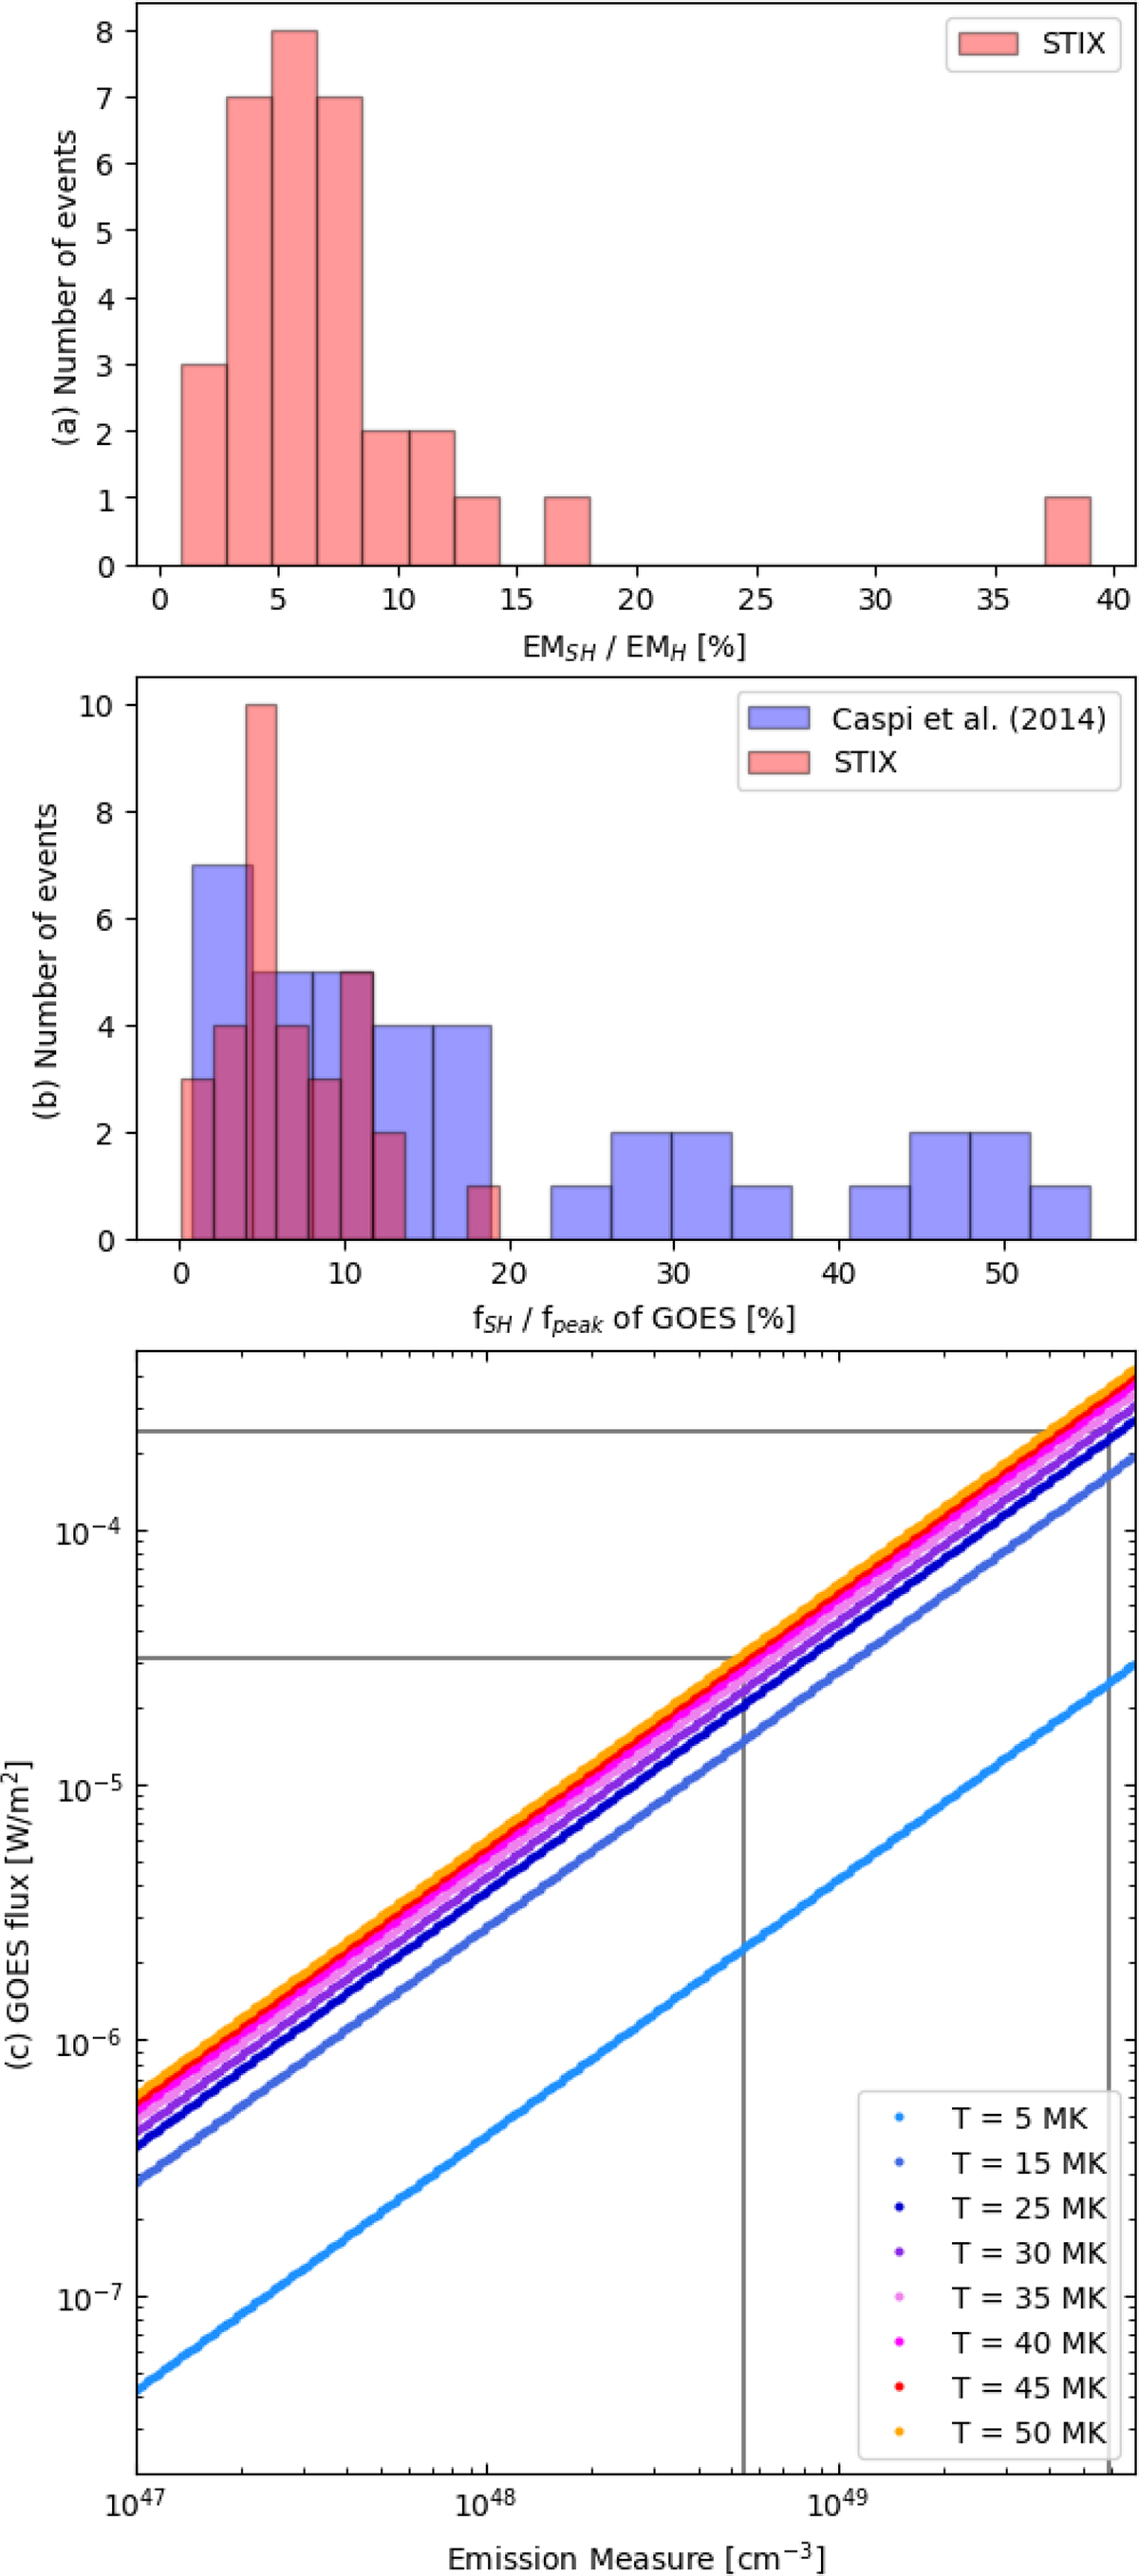
Panel (a) shows the histogram plot of the ratio in percentage between the superhot EM and the hot EM using the 32 STIX flares. Panel (b) gives the ratio in percentage between the estimated GOES flux of the superhot component and the GOES peak flux (=GOES flare class). Panel (c) shows the GOES flux as a function of the EM. The different colors correspond to different temperatures, from blue to orange, as the temperature increases.
Current usage metrics show cumulative count of Article Views (full-text article views including HTML views, PDF and ePub downloads, according to the available data) and Abstracts Views on Vision4Press platform.
Data correspond to usage on the plateform after 2015. The current usage metrics is available 48-96 hours after online publication and is updated daily on week days.
Initial download of the metrics may take a while.