Open Access
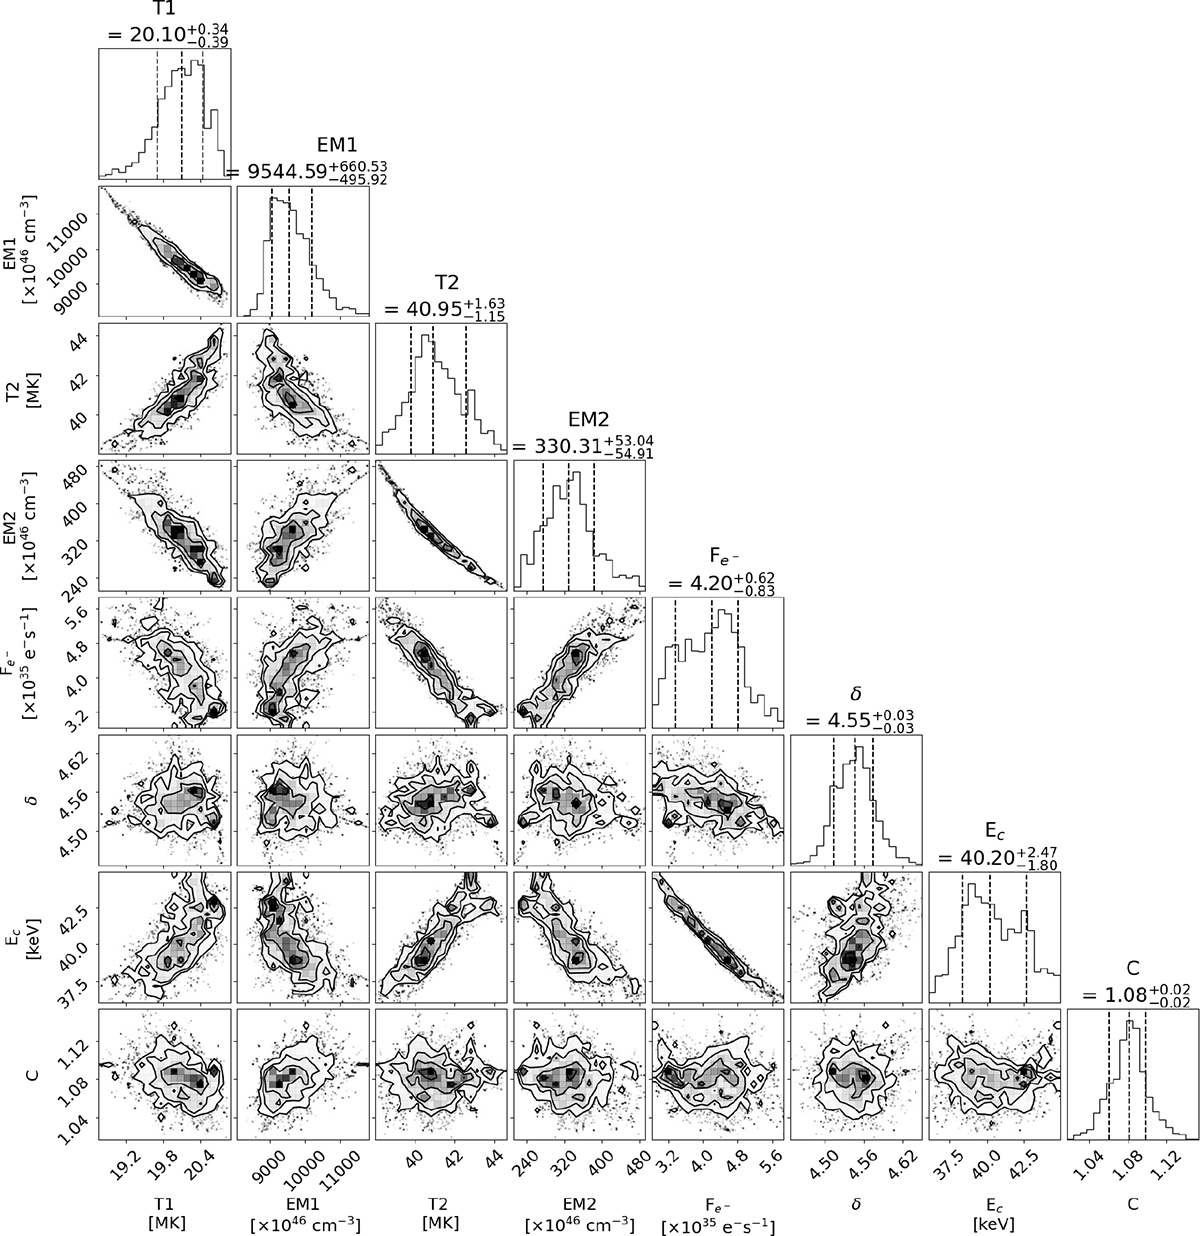
Fig. A.1.
Download original image
MCMC analysis of the fit shown in Fig. 2 (b). The diagonal plots show the histogram plots of the individual parameters fit in the photon model. The other plots show the correlations between two different parameters.
Current usage metrics show cumulative count of Article Views (full-text article views including HTML views, PDF and ePub downloads, according to the available data) and Abstracts Views on Vision4Press platform.
Data correspond to usage on the plateform after 2015. The current usage metrics is available 48-96 hours after online publication and is updated daily on week days.
Initial download of the metrics may take a while.