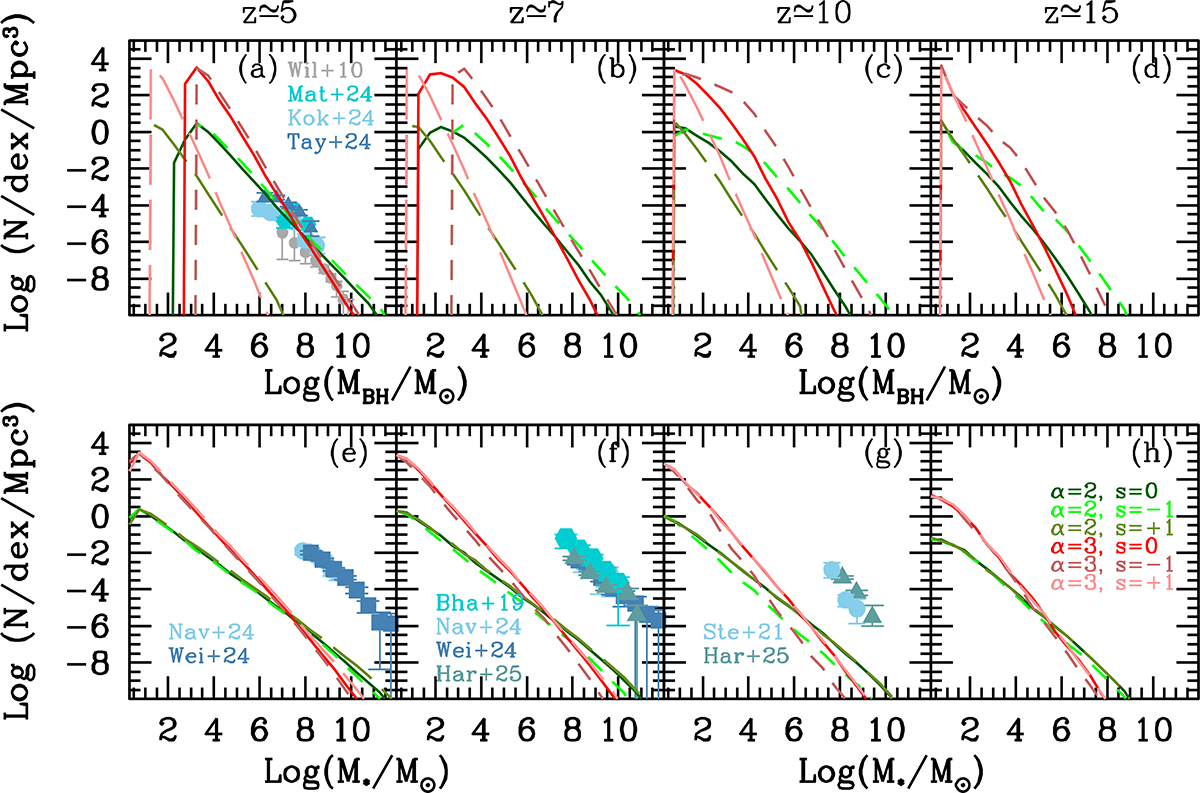
Fig. 3.
Download original image
The redshift evolution of the black hole mass function (top panel) and the stellar mass function (bottom panel) at z ∼ 5 − 15, as marked. Lines show PBH-seeded mass functions for different spectral slopes and spins, as marked. In panel (a), we show the observed BHMF at z ∼ 5 from a number of groups: Wil+10 (Willott et al. 2010), Mat+24 (Matthee et al. 2024), Kok+24 (Kokorev et al. 2024) and Tay+25 (Taylor et al. 2025a). In the bottom panels (e-g), points show the observed stellar mass functions inferred by Nav+24 (Navarro-Carrera et al. 2024), Wei+24 (Weibel et al. 2024), Bha+19 (Bhatawdekar et al. 2019), Har+25 (Harvey et al. 2025) and Ste+21 (Stefanon et al. 2021), as marked.
Current usage metrics show cumulative count of Article Views (full-text article views including HTML views, PDF and ePub downloads, according to the available data) and Abstracts Views on Vision4Press platform.
Data correspond to usage on the plateform after 2015. The current usage metrics is available 48-96 hours after online publication and is updated daily on week days.
Initial download of the metrics may take a while.