Fig. 1
Download original image
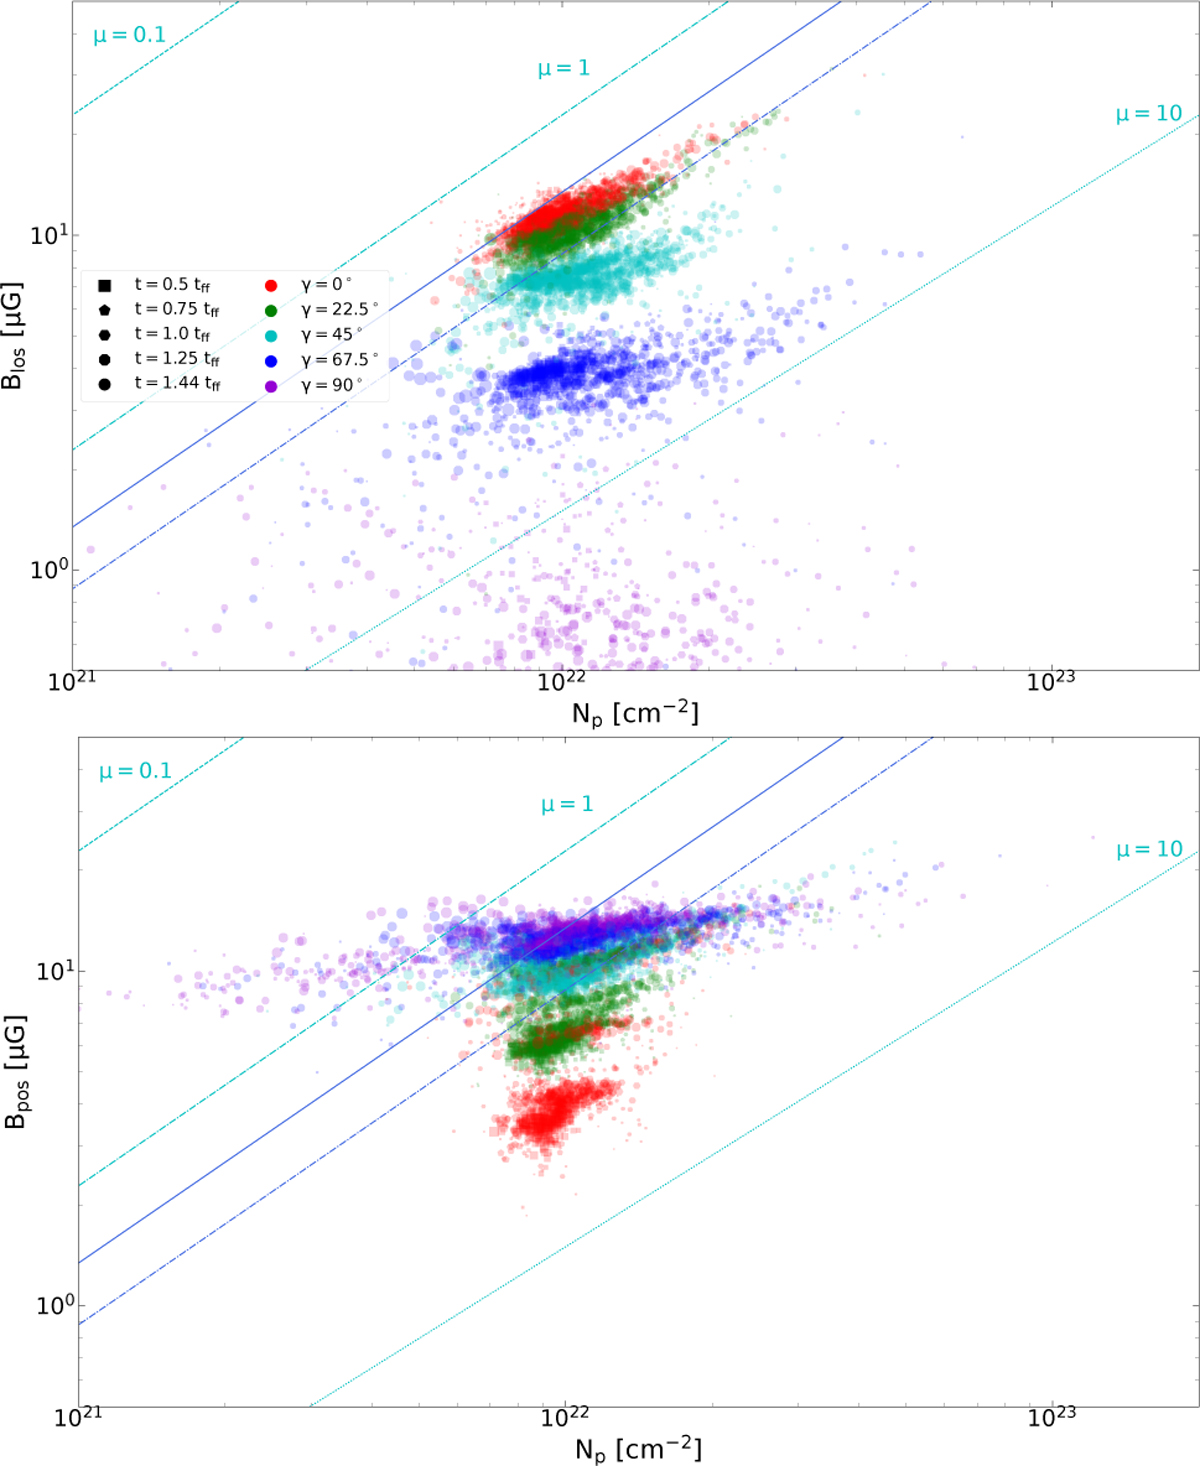
Magnetic field column density relation from our simulation considering the LOS and POS components of the field (upper and lower panels, respectively). The dashed, dash-dotted, and dotted cyan lines mark constant mass-to-flux ratios of µ/µcrit of 0.1, 1, and 10, respectively. The thin solid blue line indicates the initial value of the mass-to-flux ratio in the cloud, and the dashed blue line marks the maximum value of the mass-to-flux ratio at a time of 1.44× tff. Colored points correspond to different projection angles, different symbols correspond to different times when the cloud is “observed,” and the size of the symbols is proportional to the size of the beam used to observe different regions of the cloud (see Sect. 2).
Current usage metrics show cumulative count of Article Views (full-text article views including HTML views, PDF and ePub downloads, according to the available data) and Abstracts Views on Vision4Press platform.
Data correspond to usage on the plateform after 2015. The current usage metrics is available 48-96 hours after online publication and is updated daily on week days.
Initial download of the metrics may take a while.