Fig. 2
Download original image
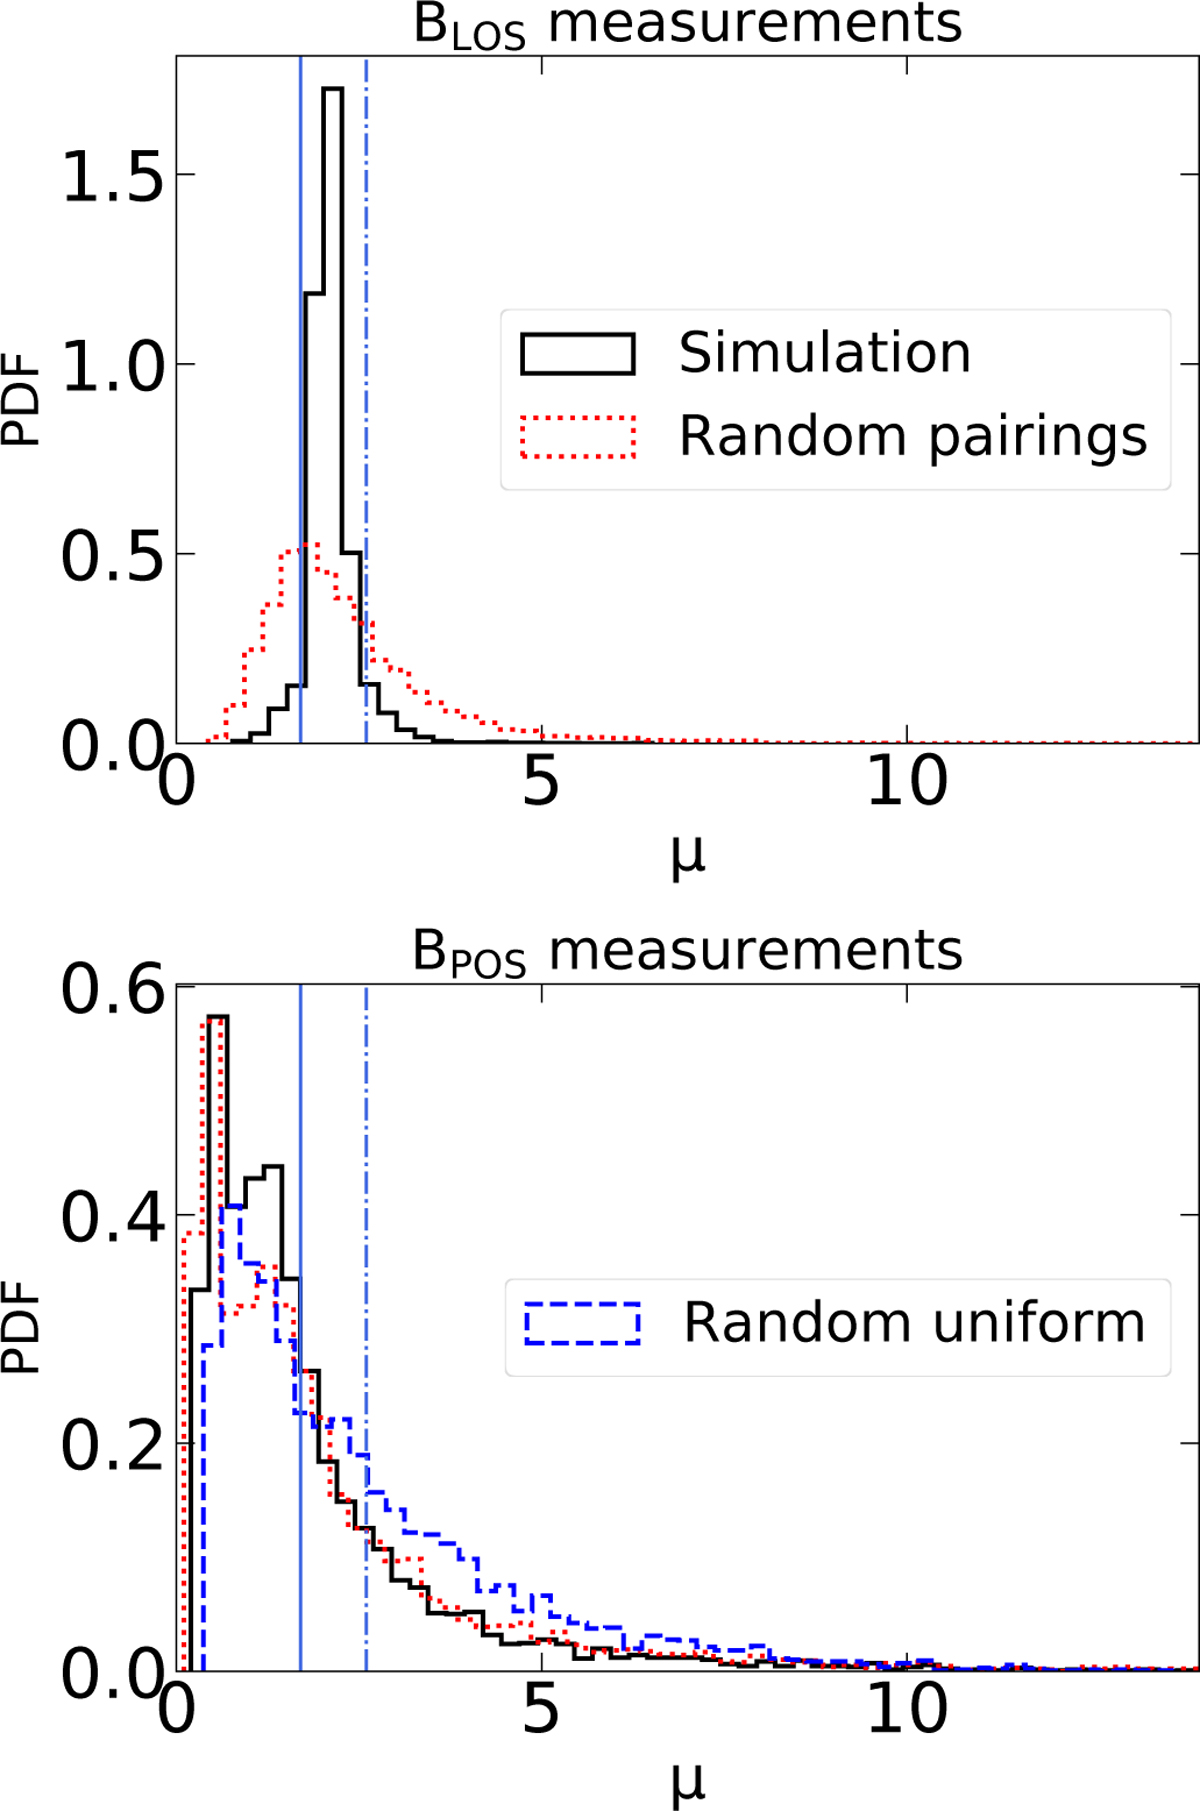
PDFs of the mass-to-flux ratio based on the LOS (upper panel) and POS (lower panel) components of the magnetic field for a time of 1.44 × tff, when the cloud has evolved to a more realistic configuration. For each case, we adopt the inclination angle that maximizes the respective component (γ = 0° for BLOS and γ = 90° for BPOS). Black curves correspond to the results from the simulation. Dotted red lines represent PDFs obtained when column densities and magnetic field strengths from different regions of the cloud (and with different beam sizes) are randomly paired. The dashed blue line shows a PDF of mass-to-flux ratios obtained by considering independent uniform random distributions for BPOS and log10Np. The vertical solid and dash-dotted blue lines indicate the initial and maximum values of the true µ, respectively. At late times, only ∼17% of BPOS estimates fall within the range defined by the true mass-to-flux ratio, while most values suggest a substantially subcritical cloud. The similarity between the BPOS distribution from the simulation and that obtained from random pairings indicates that such measurements do not preserve the underlying correlation between the magnetic field strength and column density.
Current usage metrics show cumulative count of Article Views (full-text article views including HTML views, PDF and ePub downloads, according to the available data) and Abstracts Views on Vision4Press platform.
Data correspond to usage on the plateform after 2015. The current usage metrics is available 48-96 hours after online publication and is updated daily on week days.
Initial download of the metrics may take a while.