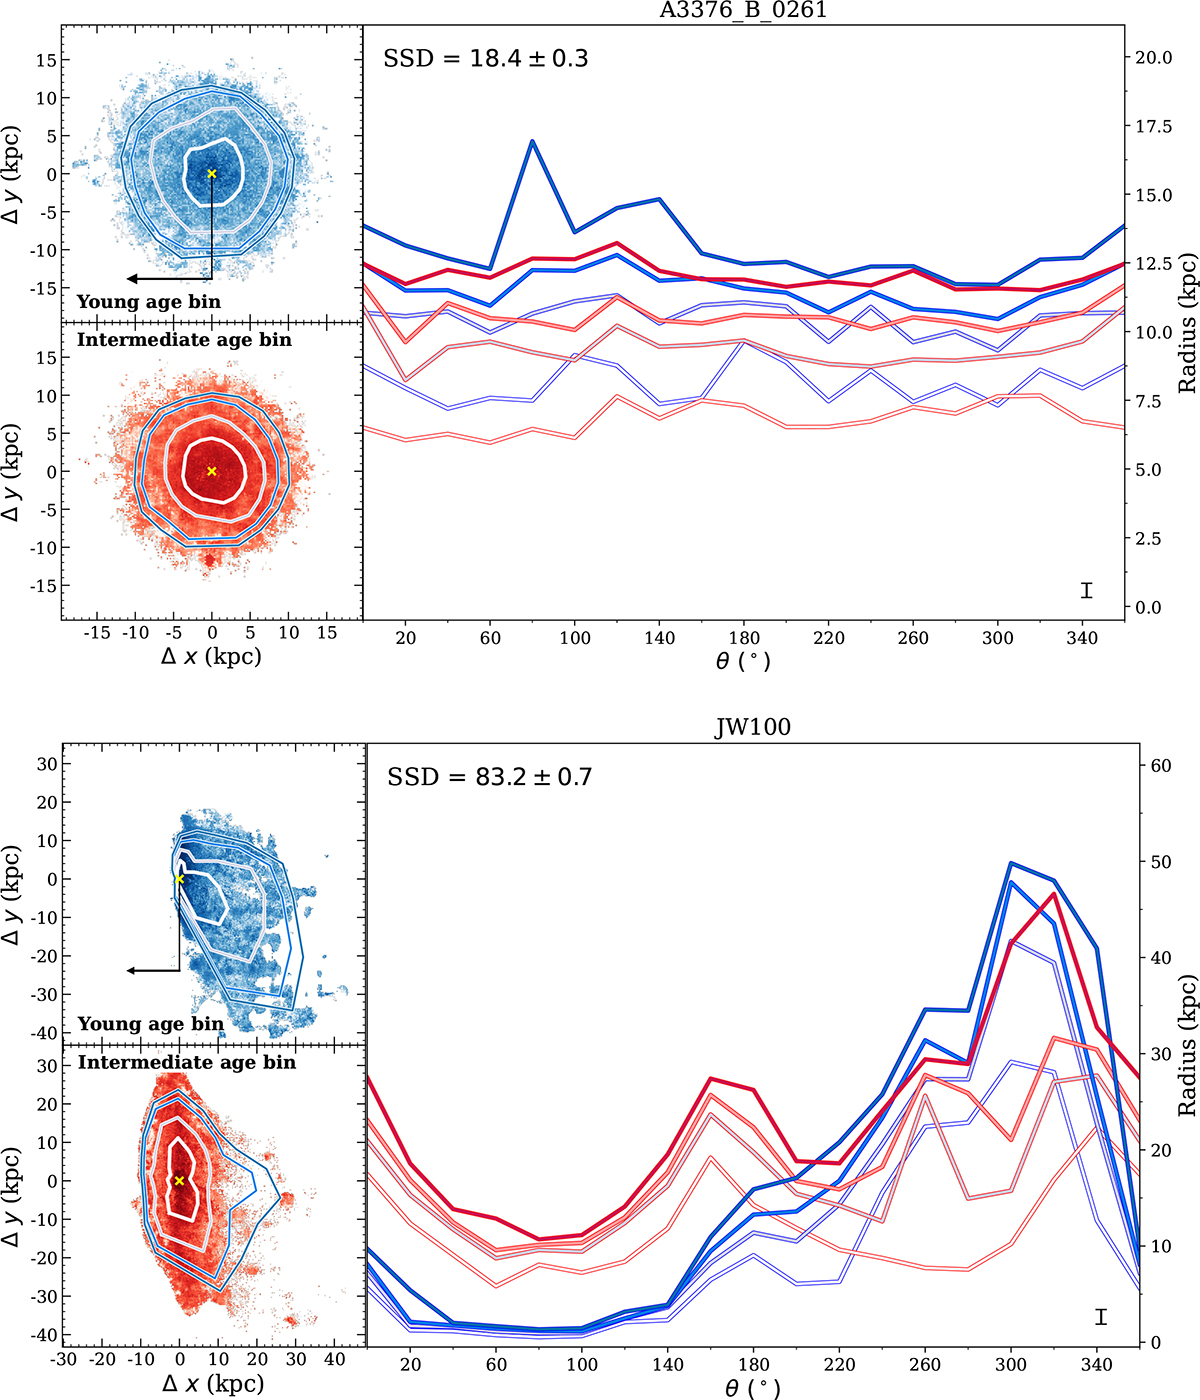
Fig. 1.
Download original image
SSD method applied to GASP galaxies. Top: Spatially resolved maps of SFRD (see text) for the control galaxy with no identified environmental effects, A3376_B_0261, obtained with SINOPSIS. The top-left frame shows the t < 20 Myr SFRD, while the bottom frame corresponds to the age interval 20 Myr ≤ t < 570 Myr. The color scale is logarithmic with SFRD within the range −4 ≲ log(SFRD) [M⊙ yr−1 kpc−2]≲ − 0.5. The black line with an arrow indicates the starting point and rotation direction of the varying angle slices (i.e., beginning from the south in clockwise rotation). Blue and red contours show the Lagrangian radii enclosing 75%, 90%, 95% and 99% of the total SFRD within each angular slice for the young and intermediate-age bins, respectively. The lines grow in a bottom-to-top orientation, following the cumulative order of the Lagrangian radii (i.e, 75%, 90%, 95%, and 99%). The black bars on the bottom-right corner of each frame correspond to the mean error of all Lagrangian radii for each case. Angle steps of Δθ = 20° were adopted. Bottom: Same as top, but for the JType = 2 galaxy, JW100. The top and bottom frames share color scales.
Current usage metrics show cumulative count of Article Views (full-text article views including HTML views, PDF and ePub downloads, according to the available data) and Abstracts Views on Vision4Press platform.
Data correspond to usage on the plateform after 2015. The current usage metrics is available 48-96 hours after online publication and is updated daily on week days.
Initial download of the metrics may take a while.